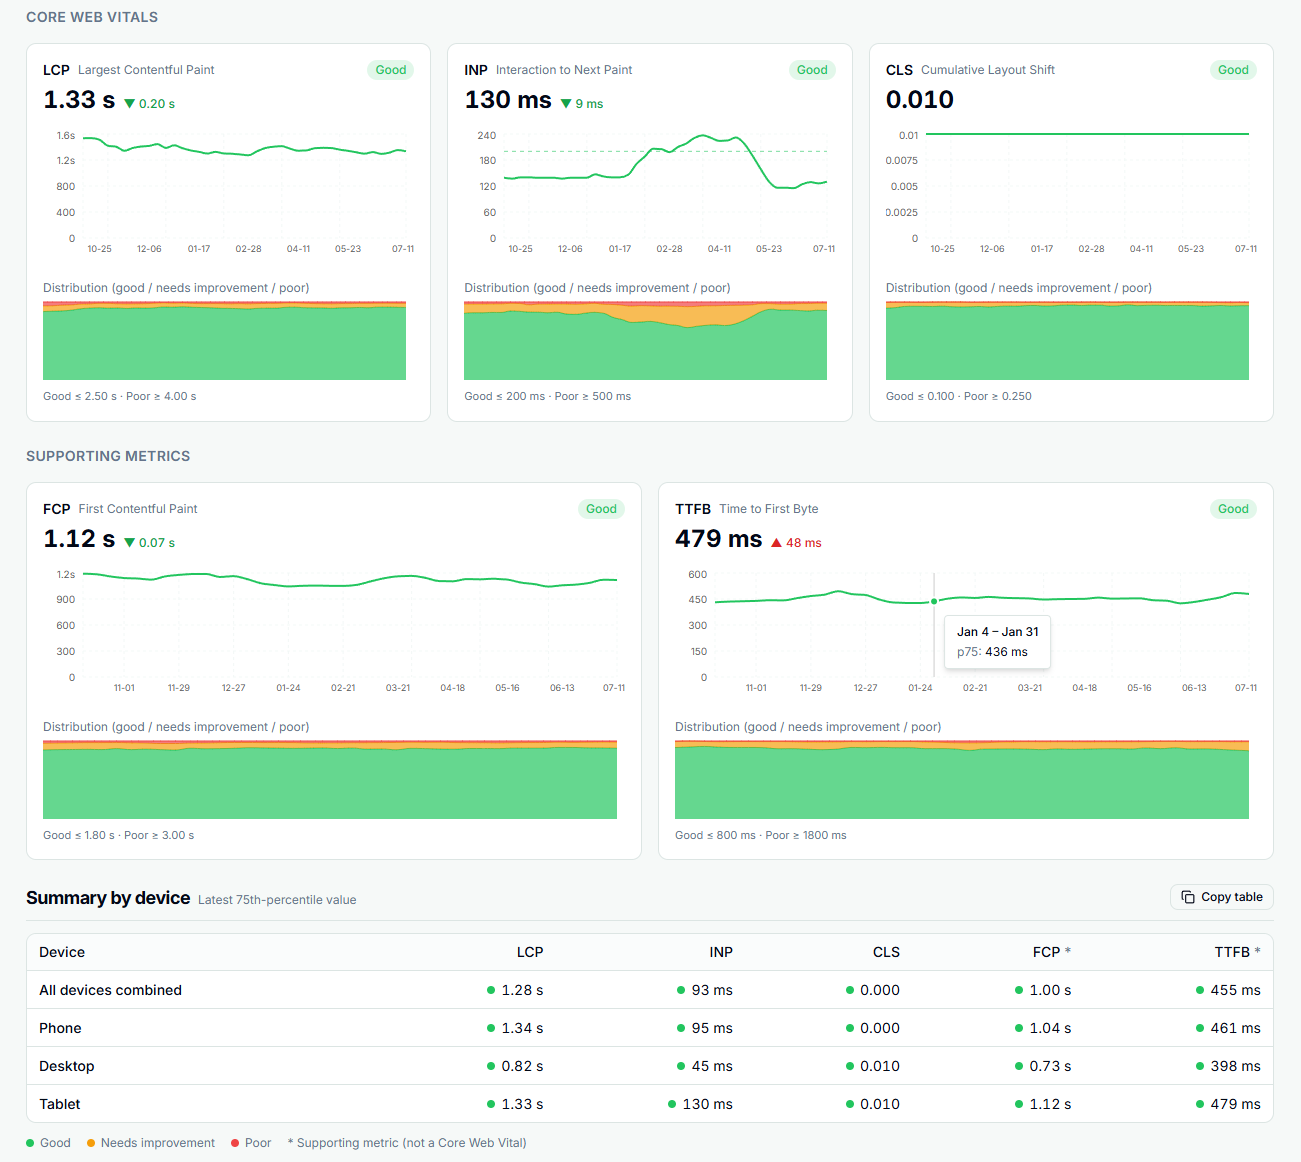
Monitor LCP, INP, and CLS with real-user field data from the Chrome UX Report: the same dataset behind Google's page experience signals. Spot regressions early, get weekly alerts by email, Slack or Teams, and see Chrome's new experimental soft-navigation and ad metrics alongside.
Trend charts and good / needs improvement / poor distributions for each metric, plus a 75th-percentile summary broken down by device. Export every weekly value to CSV, or any chart to PNG.
Real-user field data from the Chrome UX Report, rated against Google's Core Web Vitals thresholds.
How it works
Three steps from a connected property to page experience you can actually act on.
1
Pick a Property or URL
Choose origin scope for the whole site or URL scope for a single page. GSC Wizard fetches its field data from the Chrome UX Report, auto-handling www vs non-www.
2
See Field Data Over Time
LCP, INP, and CLS plus supporting FCP and TTFB, each with a p75 trend and good / needs improvement / poor distribution across up to 40 weekly periods.
3
Get Alerted on Regressions
Turn on weekly monitoring and get an email the moment a Core Web Vital slips a rating bucket week over week, before it starts costing you rankings.
Page experience data you can trust and act on
Core Web Vitals are a Google ranking signal. GSC Wizard shows the real numbers Google measures, so you know exactly where you stand.
Real users, not lab scores
Field data from real Chrome visitors over a rolling 28-day window: the same Chrome UX Report source Google uses for page experience. No synthetic Lighthouse runs that miss what people actually feel.
Device-level breakdown
Compare phone, desktop, and tablet, or all devices combined, in one summary table. Mobile often tells a very different story: this is where you catch it.
Weekly regression alerts
Get an alert when LCP, INP, or CLS drops from Good to Needs improvement or Poor: by email to up to five extra recipients, and in Slack or Microsoft Teams. Set custom good / poor thresholds per property.
The five metrics that shape page experience
Every value is the 75th percentile of real visits, rated against Google's official thresholds. The three Core Web Vitals drive the ranking signal; FCP and TTFB help you diagnose why a vital is slipping.
LCP - Largest Contentful Paint, loading. Good ≤ 2.5s, Poor ≥ 4.0s
INP - Interaction to Next Paint, responsiveness. Good ≤ 200ms, Poor ≥ 500ms
The Chrome UX Report publishes more than the Core Web Vitals. GSC Wizard shows the experimental metrics too, clearly marked, so you see changes coming before Google starts using them.
Soft navigations New
Single-page apps change pages in JavaScript, and the standard Core Web Vitals never see those in-app clicks. Since October 2026 CrUX also measures LCP, INP and CLS including soft navigations. Each one sits next to the page-load-only value for the same week, rated against the same thresholds. Google plans to switch Search Console to these in May 2027.
Ad experience
Where Chrome detected ads, see ad count, ad density, ad CPU and ad network weight as weekly trends: how much of the screen ads take, and what they cost in CPU and bandwidth, the budgets INP and LCP are spent from. Chrome sets no targets for them, so they are shown, never rated.
In your AI assistant
The same data, soft-navigation and ad metrics included, is available through the GSC Wizard MCP server. Ask Claude, ChatGPT or any MCP client which vital slipped this week, or whether a new ad partner moved INP.
Frequently asked questions
What are Core Web Vitals?
Core Web Vitals are Google's three field metrics for real-world page experience: Largest Contentful Paint (LCP) for loading, Interaction to Next Paint (INP) for responsiveness, and Cumulative Layout Shift (CLS) for visual stability. They are part of Google's page experience signals. GSC Wizard also tracks two supporting metrics: First Contentful Paint (FCP) and Time to First Byte (TTFB).
Where does the Core Web Vitals data come from?
GSC Wizard reads the Chrome UX Report (CrUX) History API: the same anonymized field dataset from real Chrome users that powers the Core Web Vitals report in Google Search Console and PageSpeed Insights. Every value is the 75th percentile (p75), so a "Good" rating means at least 75% of real visits met the target.
How is this different from a Lighthouse score?
Lab data (Lighthouse, the PageSpeed score) is a single synthetic test on one simulated device. Field data is measured from real users over a rolling 28-day window and is what Google actually uses for page experience. GSC Wizard shows field data, so what you see reflects what real visitors experience, and what Google evaluates.
How far back can I see the history?
Up to 40 weekly collection periods, roughly nine months of history. Each metric is charted over time alongside its good / needs improvement / poor distribution so you can see exactly when a change happened.
How do the weekly alerts work?
Turn on monitoring for a property and device, and each week GSC Wizard checks whether LCP, INP, or CLS dropped from one rating bucket to a worse one week over week (for example Good to Needs improvement). If it did, you get an email, plus up to five extra recipients, and, if you connected them, a Slack or Microsoft Teams message. You can set custom good and poor thresholds per property. Weekly alerts run on your own free Chrome UX Report API key.
Can I track a single page or the whole site?
Both. Origin scope reports Core Web Vitals for the whole site, while URL scope reports a specific page. GSC Wizard automatically falls back between the www and non-www host when only one has enough field data.
What are soft navigations, and why are they shown separately?
A soft navigation is a page change a single-page app makes in JavaScript, without a full page load. The standard Core Web Vitals only measure full page loads, so on such sites every in-app click is invisible to them. Since October 2026 the Chrome UX Report also publishes experimental versions of LCP, INP and CLS that count soft navigations too. GSC Wizard shows them next to the standard values for the same week, rated against the same thresholds. Search Console keeps using the standard values until Chrome graduates the new ones, which it plans for May 2027, so alerts stay on the standard metrics.
What are the ad metrics?
Where Chrome detected ads on a site, the Chrome UX Report adds four experimental ad metrics: ad count, ad density (the share of the viewport ads take up), ad CPU and ad network weight. GSC Wizard shows each as a weekly 75th-percentile trend. Chrome sets no good or poor targets for them, so they are reported but never rated. Sites without ads simply do not get this section.
Can I ask an AI assistant about my Core Web Vitals?
Yes. The GSC Wizard MCP server has a Core Web Vitals tool that returns the same field data, including the soft-navigation and ad metrics and the week-over-week regressions, so Claude, ChatGPT or another MCP client can answer questions about it directly.