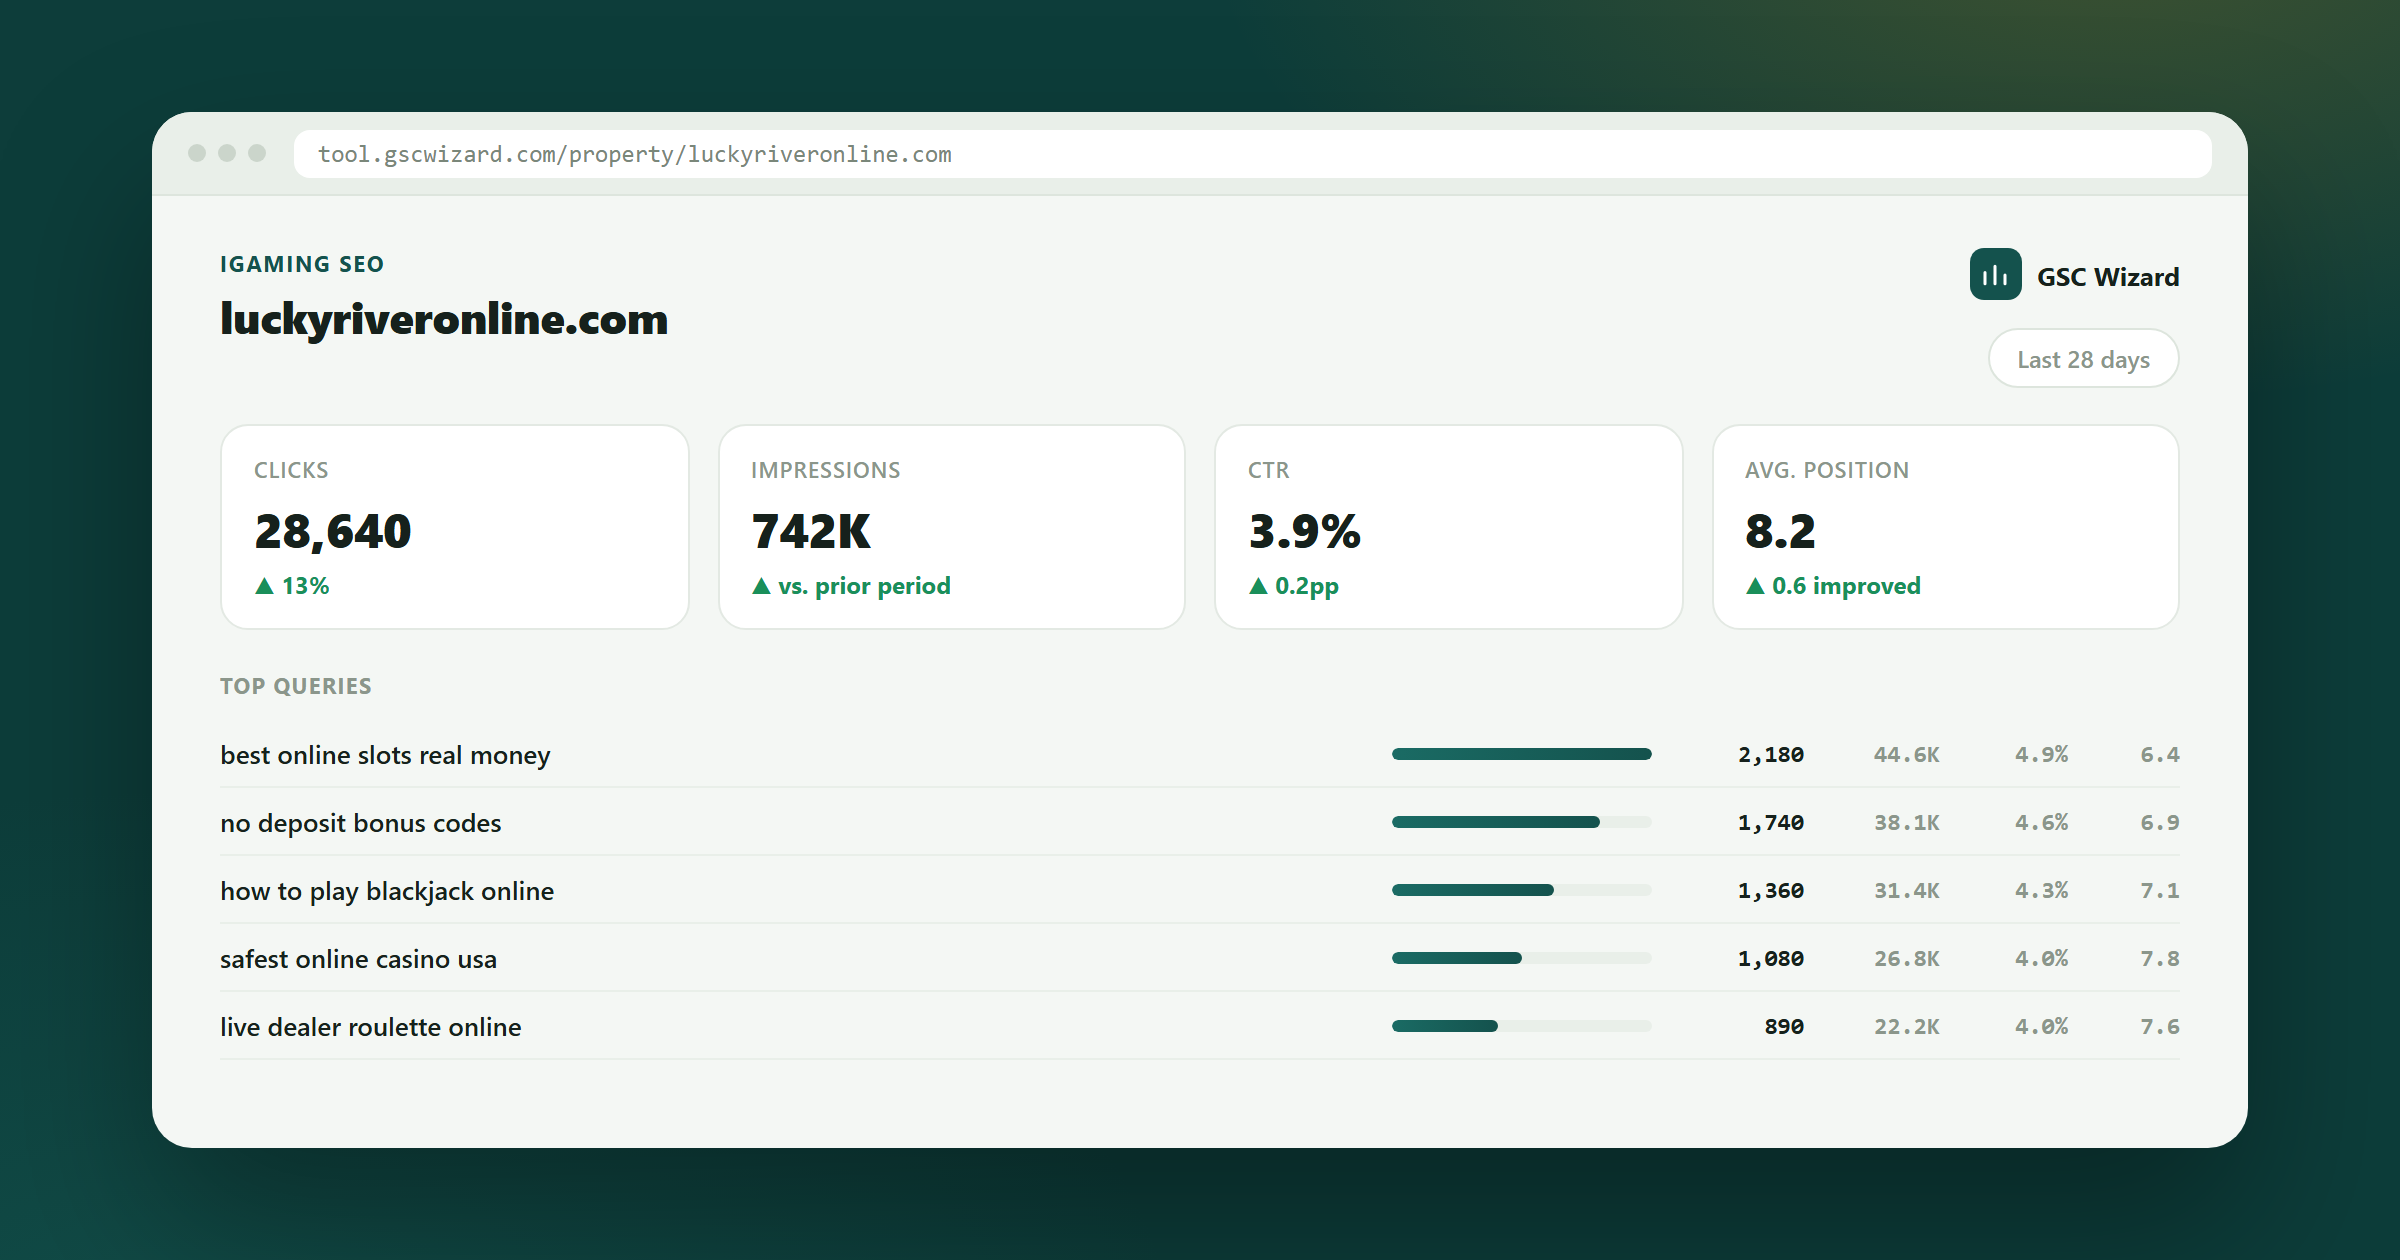
iGaming SEO
In iGaming a market is a business unit. When Sweden drops 40% and Germany climbs 30%, the sitewide chart is flat and your report says nothing happened. GSC Wizard tracks every market on its own line, dates the drops, and separates volatility from an actual loss.
Country, device and market-level reporting with history that outlives Google's 16 months.
Why aggregate reporting fails here
A flat total across ten regulated markets is not stability. It is two crises cancelling out.
iGaming SERPs churn harder than almost any vertical, and each licensed market is a separate SERP with separate competitors and separate rules. Reporting on the total is like reporting one P&L for ten countries: technically accurate, operationally useless.
Three things that do not apply to a normal content site.
A 15% weekly swing that would be an emergency elsewhere is a Tuesday here. Threshold alerts either fire constantly and get ignored, or get set so high they only trigger after real damage. You need a method that knows the difference between noise around a stable mean and an actual step down.
You operate per licence: different domains or folders, different languages, different competitors. Google can reshuffle one market's SERP entirely without touching the others. Aggregate reporting is where that news goes to die.
The operator review, the bonus-code page, the 'no deposit' variant and the top-10 list all chase the same query. Google rotates which one it shows, average position looks unstable, and no page ever consolidates enough authority to hold the top spot.
Market segmentation first. Everything else follows from it.
Country breakdowns plus content groups per language folder give you one line per licensed market. From then on every chart, alert and export is per market, and the aggregate is just a footnote.
Change-point detection looks for a statistical break in the series rather than a threshold crossing, which is exactly what a high-variance vertical needs. It separates the usual churn from a genuine step down, and it gives you the date.
Cannibalization analysis shows every URL competing for a term and how often Google picks each one. On iGaming that usually means merging three bonus variants into one page that can actually rank.
Regulatory changes, market entries and de-indexing events need multi-year context. Full storage properties keep up to 10 years of Search Console data, so you can still show what a market looked like before the last licence change.
One line per licence. The aggregate is at the bottom, where it belongs.
IGAMING MARKET REPORT - week 34

MARKET     clicks     vs 4wk    signal
  SE       88,400      -38%     STEP CHANGE 11 Aug, high confidence
  DE      142,900      +31%     step change 09 Aug (competitor loss?)
  NL       61,220       -4%     within normal variance
  ON/CA    44,880       +6%     within normal variance
  UK      210,540       -2%     within normal variance
  ---------------------------------------------
  TOTAL   547,940       -1%     'nothing happened'

SE DETAIL - what moved
  Review pages     pos 4.1 -> 9.6
  Bonus pages      pos 3.8 -> 4.0   (unaffected)
  -> section-specific, not sitewide. Check review template + E-E-A-T.

CANNIBALIZATION - SE
  'casino bonus utan insattning'  3 URLs, Google alternates weekly
Read the bottom line first and you would have closed the report. That is the whole argument for per-market monitoring.
Per-market click index
Each market indexed to its own 12-week baseline. Percentages against a shared total are meaningless when markets differ by an order of magnitude.
Change points, not thresholds
Count of statistically detected breaks per market per quarter. In a high-variance vertical this is the only alerting that survives contact with reality.
Cannibalization entropy
How spread out your rankings are across competing URLs for a term. High entropy means Google cannot decide, which means none of your pages is winning.
Brand versus generic split
Operator-brand queries behave completely differently from generic 'best casino' terms. Tracking them together hides both a brand campaign's effect and a generic ranking loss.
Yes. Combine the country breakdown with content groups for your language folders or market subdomains, and every report splits per market. Scheduled reports and shared report links can be scoped the same way, so each market manager gets only their own numbers.
Change-point detection tests whether the series has genuinely shifted to a new level rather than whether it crossed a threshold today. In a vertical that swings 15% a week, that distinction is the entire value of the report.
Yes. Each domain is added as its own property, and the cross-site summary puts them on one screen so you can compare markets without switching accounts. Team seats let market managers see their own properties.
Because the events you need to explain - a licence change, a market entry, a regulatory ad ban, a core update two years ago - fall outside Google's retention window. Full storage properties keep up to 10 years, so the comparison is still there when the question gets asked.
Written by Jan-Willem Bobbink · Published August 27, 2026
Affiliate SEO
Position 3 with a bad title loses to position 5 with a good one. CTR is the affiliate's cheapest lever.
Hotel SEO
Your own hotel name is your most valuable keyword, and an OTA is probably outranking you for it.
Agency SEO
The report is the product. Automate it and you get the margin back on every retainer.
Connect your properties and get per-market monitoring that does not hide a 38% drop inside a flat total.
Practical GSC and GA4 workflows, product updates and SEO experiments. No spam, unsubscribe anytime.