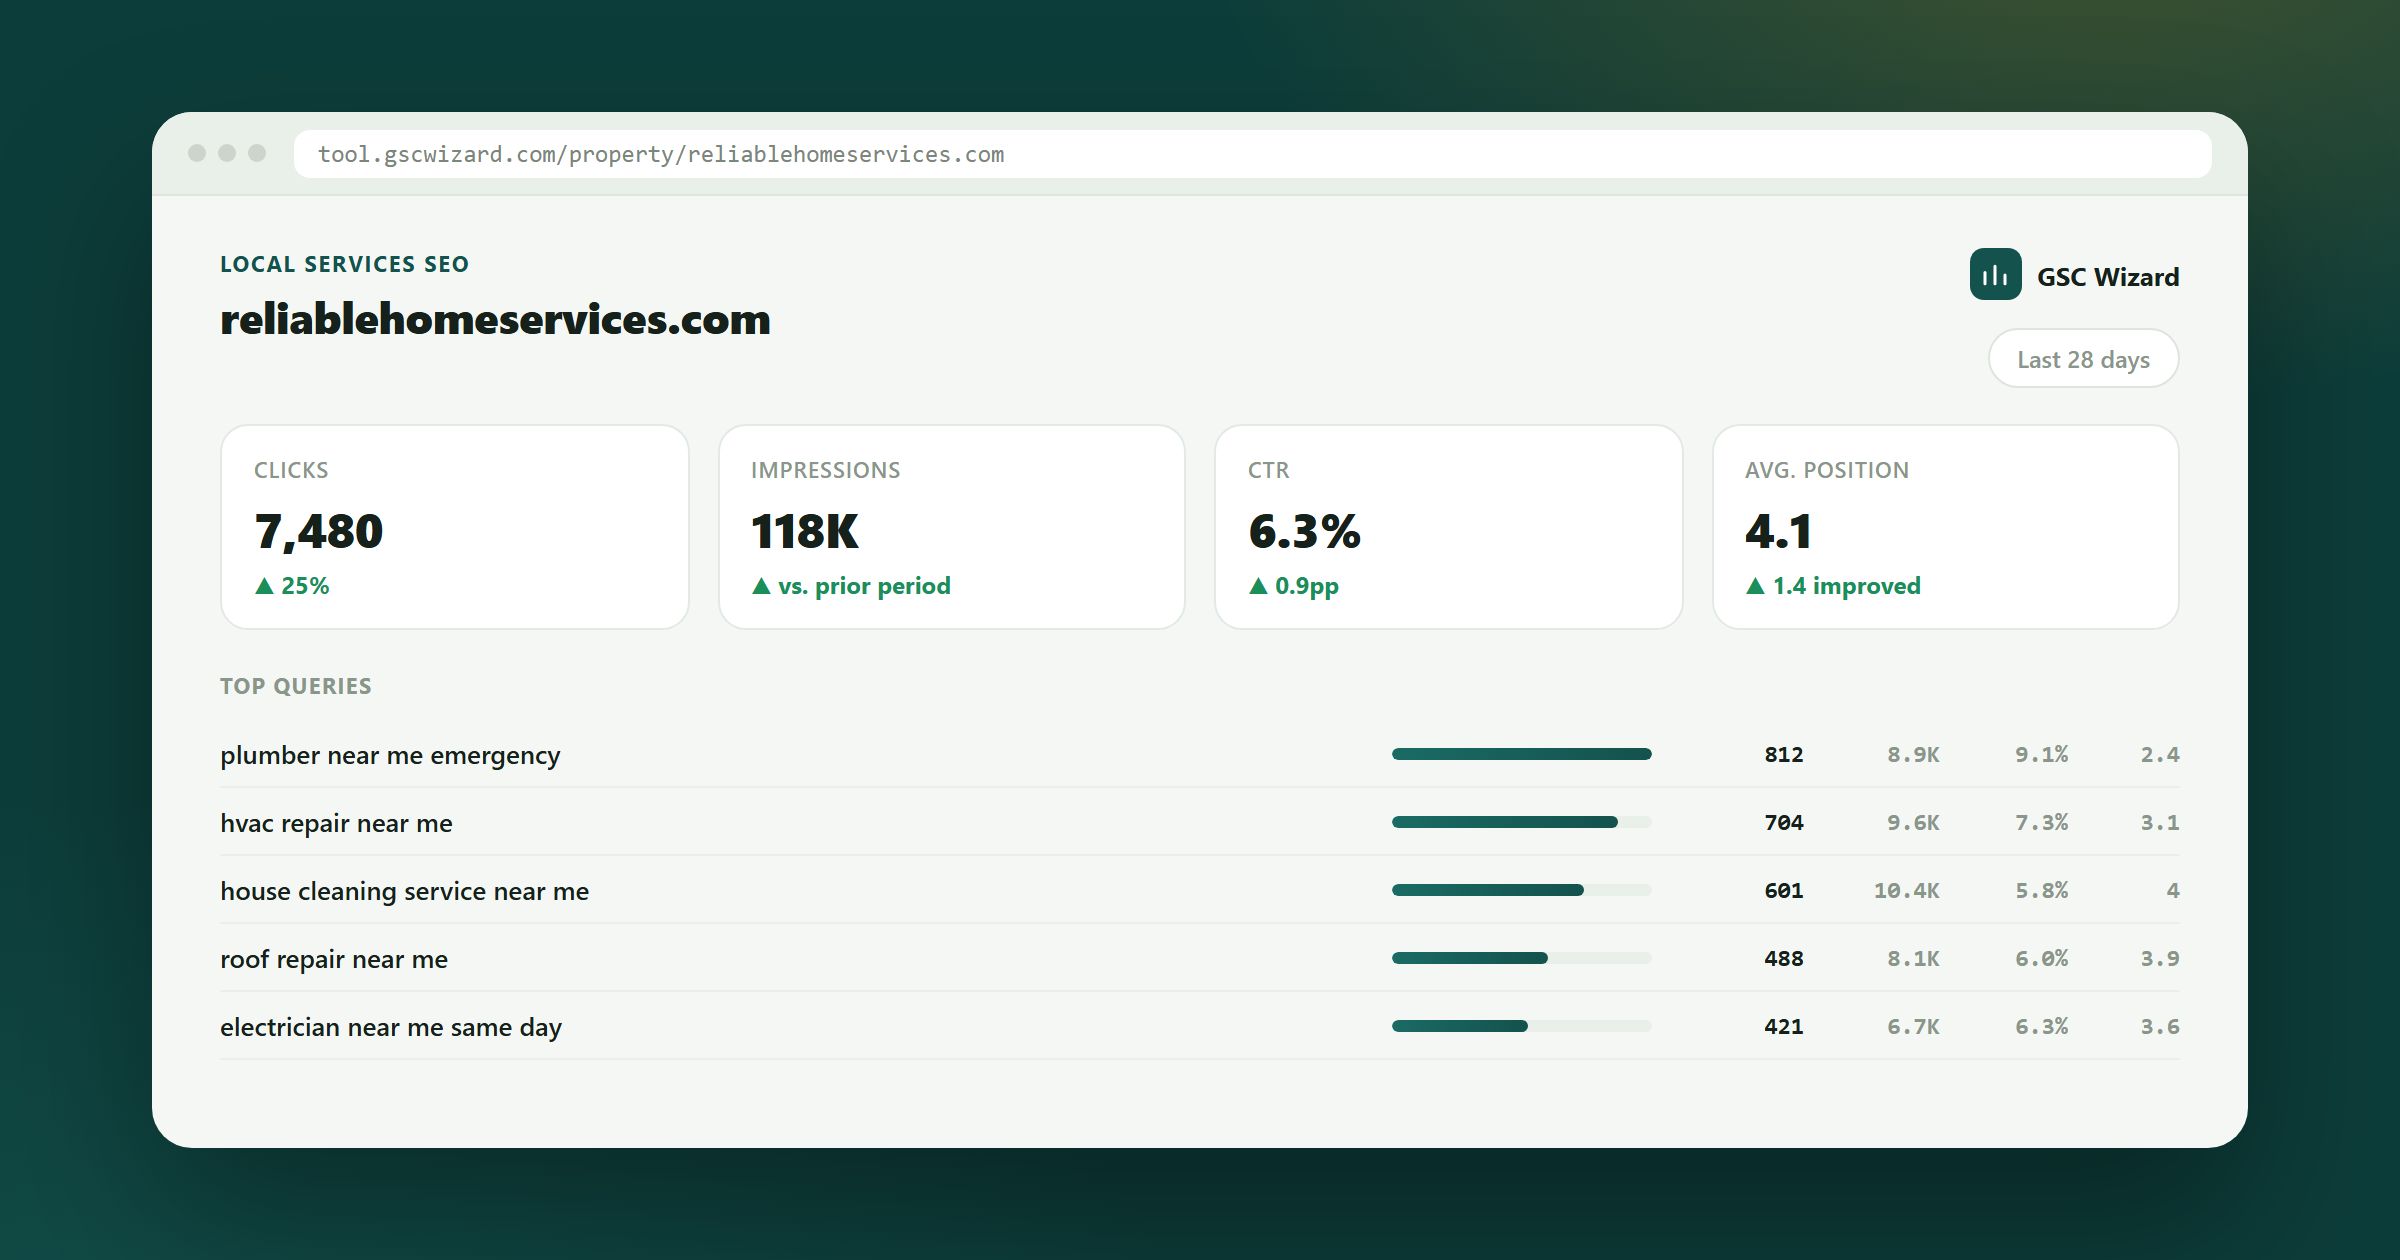
Local services SEO
In trades, demand moves more than rankings do. A cold snap doubles boiler searches and your report calls it a win; a mild winter halves them and it calls it a failure. GSC Wizard separates the demand signal from your actual performance, so you can tell which one moved.
For plumbers, HVAC, electricians, roofers and anyone selling a service by city.
Demand versus performance
Impressions measure the weather. Position measures you. Reporting clicks conflates the two.
Clicks are demand multiplied by performance, which is why they explain nothing on their own. Impressions rise and fall with the season regardless of what you do. Position and CTR are what your marketing actually controls, and they are what should carry the report.
The seasonality is not a nuisance to smooth away. It is most of the variance.
Traffic climbs 60% in the first cold week of November. If you happened to publish content or change a title in October, that gets the credit, and the same change gets blamed in April. Whole strategies get built on the calendar being mistaken for causation.
'Emergency plumber near me' converts within the hour at premium rates. 'Bathroom renovation cost' converts in three months, maybe. They live in the same Search Console property, get reported as one number, and get optimised as if they were the same job.
Six services times fifteen towns is ninety near-identical pages. Some rank, most do not, several compete with each other, and nobody has ever looked at the grid as a grid. It is the single most common source of wasted pages in local SEO.
Strip the seasonality out first, then read the grid.
Time-series decomposition splits your traffic into trend, seasonal pattern and residual. The trend line is the one that answers 'is the site getting better', and it is invisible in the raw chart.
Traffic forecasting projects the coming weeks from your own history, including the seasonal shape. For trades that turns SEO reporting into something the operations side can use for scheduling.
URL clustering groups the near-identical service and location pages so you can see which cells of the grid rank, which are dead weight, and which are competing with each other.
Query analysis buckets urgent and near-me phrasing separately from research phrasing, so the high-margin emergency segment gets its own trend line and its own alerts.
Written so a cold snap cannot take credit for your work.
LOCAL SERVICES REPORT - November

RAW CLICKS            18,400   +61% vs October
  Seasonal component          +54%   (weather, not you)
  Underlying trend             +7%   <- the real result

BY INTENT             clicks    avg pos
  Emergency / urgent    6,220      3.2    premium jobs
  Repair / fix          7,840      5.4
  Install / replace     3,110      7.9
  Research / cost       1,230     11.2

SERVICE x CITY GRID - 90 pages
  Ranking top 10        31
  Positions 11-30       22    <- the actionable middle
  No impressions        37    <- consider pruning or merging

COMPETING PAGES
  'boiler repair [town]' - service page and town page both rank,
  alternating. Merge into the town page.

FORECAST  next 4 weeks 21,000-24,500 clicks (seasonal peak)
The first block is the whole point: plus 61% reads as a triumph, plus 7% underlying is the honest number, and it is still good.
Deseasonalised trend
Your traffic with the seasonal component removed. The only line that tells you whether the site improved, rather than whether it got cold.
Emergency segment position
Rankings on urgent-intent queries only. These are the highest-margin jobs and they behave nothing like research traffic.
Grid coverage rate
What share of your service-by-city pages rank in the top ten at all. Most trades sites discover a third of their pages have never had an impression.
Impressions versus position
Impressions falling while position holds is a demand story. Position falling while impressions hold is your story. Never report one without the other.
Time-series decomposition separates the seasonal component from the underlying trend using your own history, so a 61% seasonal rise and a 7% real improvement are shown as two different numbers instead of one flattering one.
The grid view answers that from your own data. Cluster the location pages and count how many have ever had an impression. When a third of them are empty, the next town page is not the highest-value work - fixing the near-miss cells in positions 11 to 30 is.
Set up the urgent-intent segment as its own group and put it in a scheduled report or a Slack summary. Because those queries are high margin, a drop there is worth knowing about well before it shows up in the sitewide total.
Traffic forecasting projects forward from your own seasonal history. It is a search-demand projection rather than a business plan, but for scheduling engineers and ad budget ahead of a peak it is usually close enough to be useful.
Written by Jan-Willem Bobbink · Published August 28, 2026
Dental SEO
At local volumes Google hides most of your queries and month-to-month numbers are noise. Report differently.
Multi-location SEO
One template change moves 200 pages. Test it on ten first and roll it out with proof.
Real estate SEO
A listing that indexes in three days sells. One that indexes in three weeks is already gone.
Separate demand from performance, read your service grid, and forecast the season ahead.
Practical GSC and GA4 workflows, product updates and SEO experiments. No spam, unsubscribe anytime.