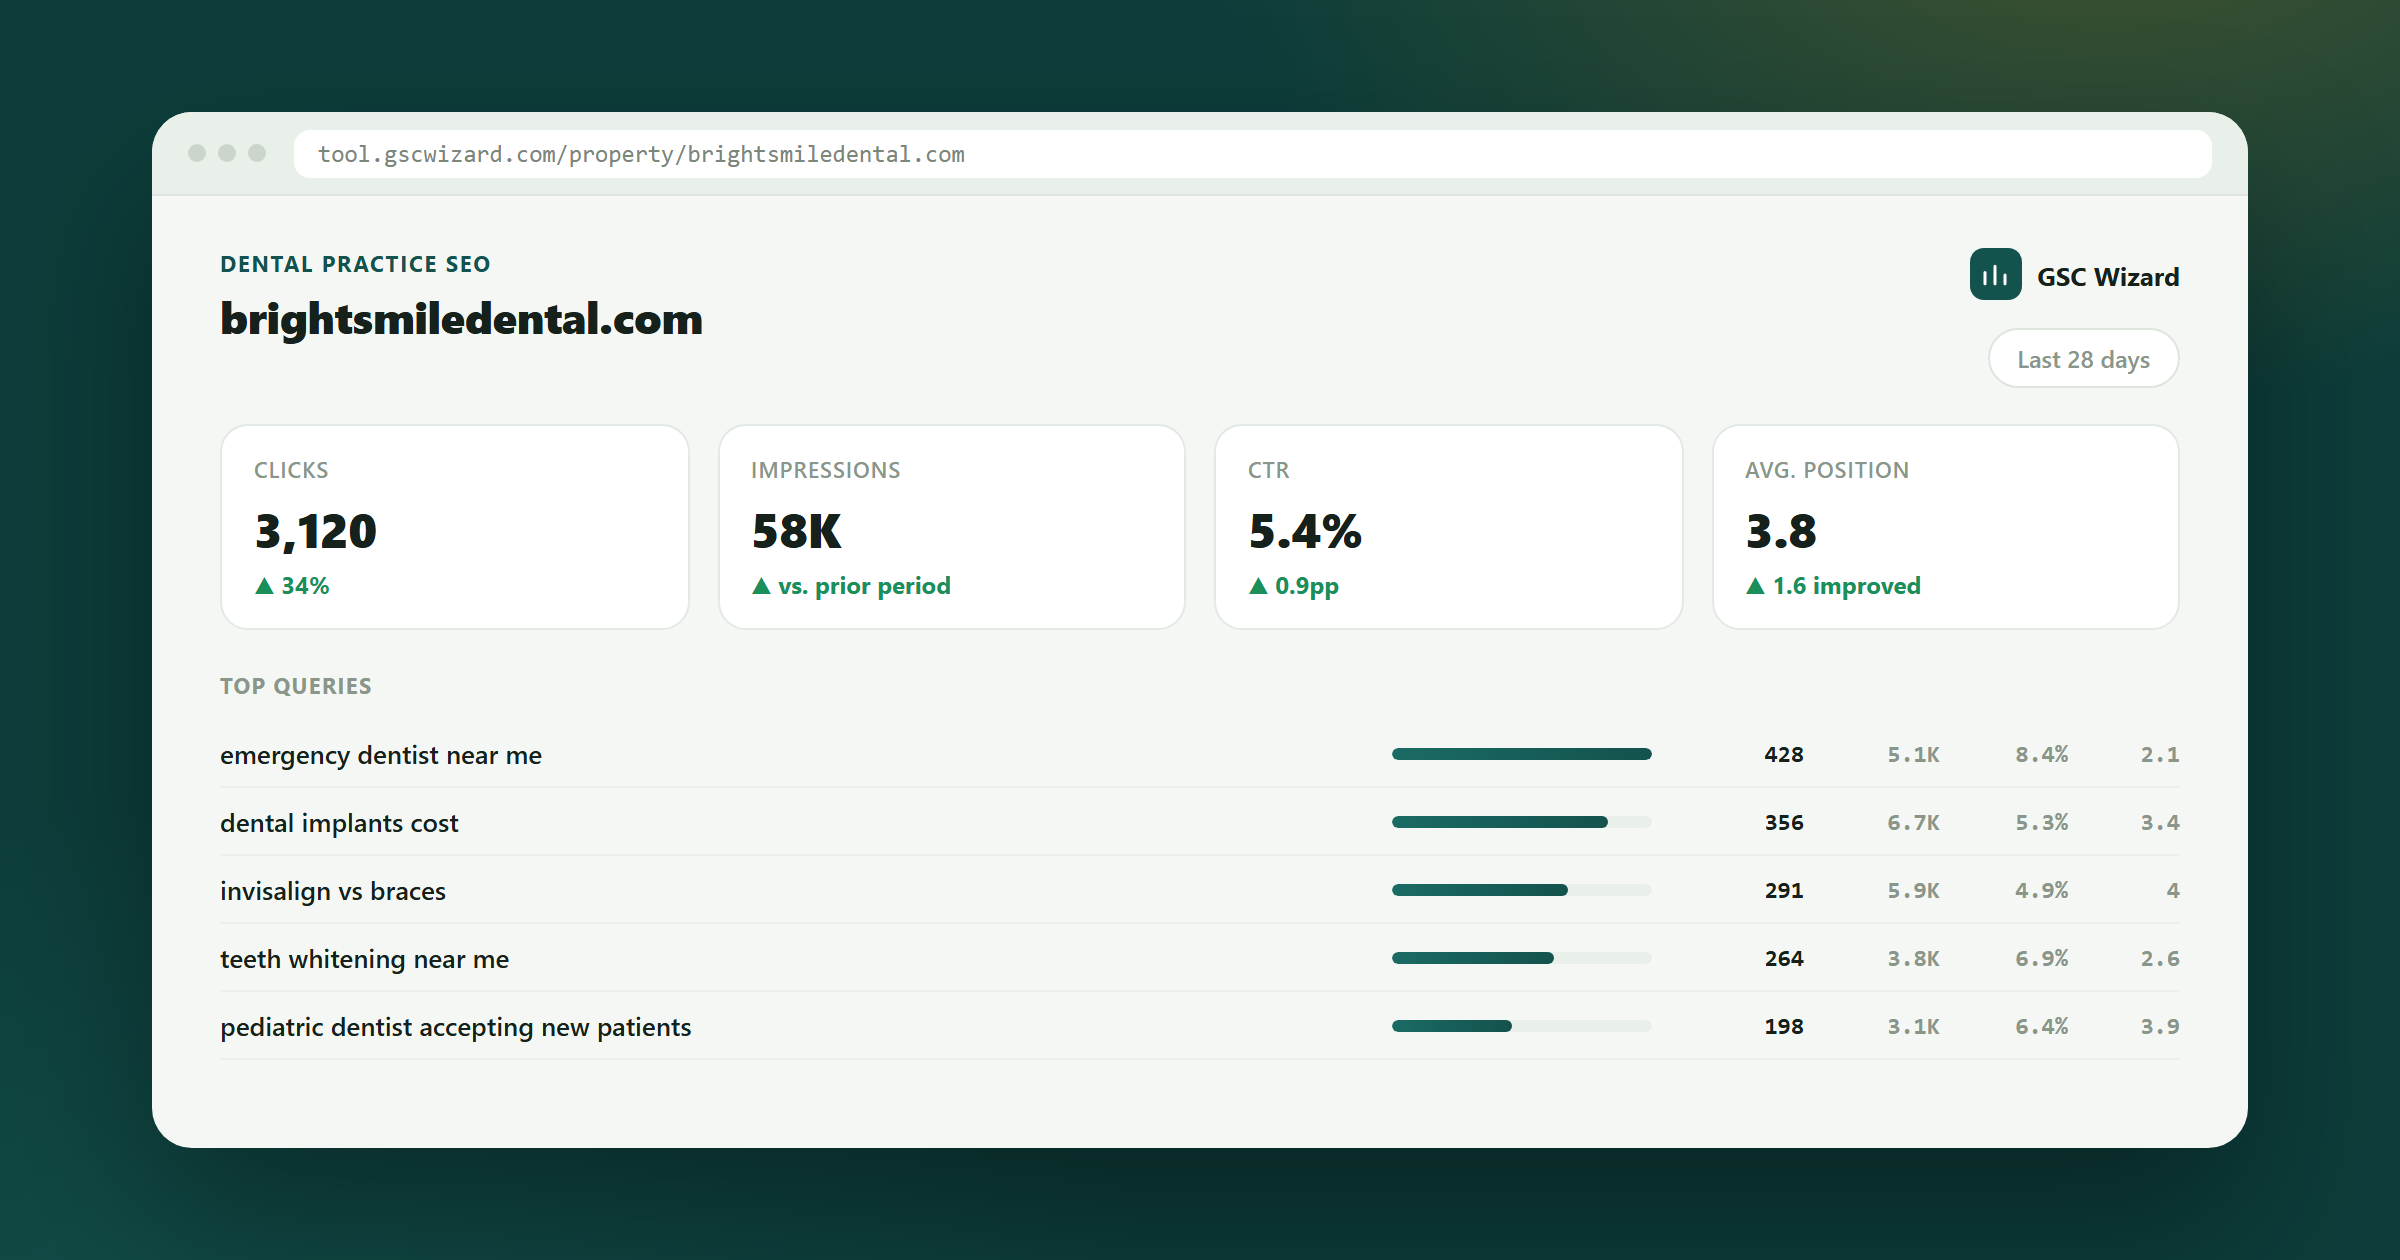
Dental SEO
A dental practice does not have a traffic problem, it has a sample-size problem. At 800 clicks a month Google hides most of your queries for privacy, and a 20% swing means nothing. GSC Wizard sets the reporting up for that reality - longer windows, discovery versus existing-patient splits, and treatment-level tracking.
Designed for single practices and small groups, not enterprise dashboards.
The small-numbers problem
Most of your search queries are invisible, and most of your monthly changes are random.
Google removes rare queries from Search Console to protect user privacy. On a local practice that can be the majority of your terms. Add small absolute numbers, where five clicks is a 15% move, and standard monthly reporting produces confident conclusions about pure noise.
The methods that work on a 100,000-click site actively mislead at 800.
Your query rows will not add up to your totals, sometimes by half. Practice owners see the mismatch, decide the tool is broken, and stop trusting the whole report. It is not a bug - it is Google's privacy filter, and it hits small local sites hardest.
People searching your practice name to find your phone number are already patients. They inflate the total and hide the only number that grows the practice: how many strangers found you via 'dentist near me', 'emergency dentist' or a treatment term.
Implants, Invisalign, whitening and emergency care have completely different values per patient and completely different competitors. They are usually reported as one lump called 'the website', so the practice never learns that the implants page has never ranked.
Fewer, longer, more meaningful numbers.
Branded query reporting separates people looking for you from people looking for a dentist. New-patient discovery is the practice-growth metric; everything else is patients finding your opening hours.
Content groups for implants, orthodontics, cosmetic, emergency and general care show which treatments the site actually attracts - usually a surprise, and usually not the ones with the biggest margin.
Flexible date ranges with a comparison period make quarter-versus-quarter the default unit instead of week-over-week. At local volumes that is the shortest window where a change is likely to be real.
The sampling impact report quantifies the anonymised-query gap on your own property, so the report opens with 'these rows cover 61% of clicks' instead of an unexplained mismatch.
Quarterly, because monthly would mostly be noise.
DENTAL PRACTICE REPORT - Q3 vs Q2

NEW PATIENT DISCOVERY (non-branded)   1,940 clicks   +18%
EXISTING PATIENTS (brand + name)      2,610 clicks    +3%
  -> discovery is the growth number. Brand is address lookups.

BY TREATMENT           clicks    avg pos   note
  Emergency dental        620       4.1    strongest performer
  General / check-ups     540       6.8
  Implants                190      12.4    <- highest value, worst rank
  Invisalign / ortho      340       8.2
  Whitening               250       9.0

QUERY COVERAGE
  Named queries cover 58% of clicks. 42% anonymised by Google.
  Read the page-level numbers as the reliable ones.

OPPORTUNITY
  'dental implants [town]' pos 12.4, 140 impressions/mo.
  Page has no treatment cost section and no FAQ. Fix both.
Two paragraphs a practice owner can act on, four times a year, instead of twelve dashboards nobody opens.
Non-branded discovery clicks
Strangers finding the practice through search. This is the growth number; branded search mostly measures patients you already have.
Position on high-value treatments
Implants and orthodontics are worth many times a check-up. Track their pages separately or their poor rankings stay invisible inside a healthy total.
Query coverage percentage
How much of your click total is explained by named queries. Report it once at the top and the 'why do the numbers not add up' conversation ends.
Quarter-over-quarter, never week-over-week
At a few hundred clicks a month, weekly changes are almost entirely random. Long windows are not laziness, they are the correct statistics.
Google withholds queries that are rare enough to identify a person, and small local sites have a lot of those. The rows you see are a subset. The sampling impact report measures how big that subset is for your property so you can state the coverage instead of guessing.
No. It works with Search Console and GA4 data, which covers your website's organic performance - treatment pages, discovery queries, indexing. Map pack and review management need a separate local tool; the two complement each other rather than overlap.
Quarterly for the practice report, with the indexing monitor running continuously in the background. At local volumes, monthly reporting mostly generates confident explanations for random variation.
Yes, and for the better - group each location's pages separately and you can compare like for like. If you are running more than a handful of locations from one template, the franchise setup covers that pattern in more depth.
Written by Jan-Willem Bobbink · Published August 28, 2026
Local services SEO
Your traffic doubled because it got cold, not because SEO worked. Separate demand from performance.
Legal SEO
One case can be worth more than a year of blog traffic. Rank your backlog by case value, not by clicks.
Multi-location SEO
One template change moves 200 pages. Test it on ten first and roll it out with proof.
Split discovery from brand, group by treatment, and get numbers you can trust at local volumes.
Practical GSC and GA4 workflows, product updates and SEO experiments. No spam, unsubscribe anytime.