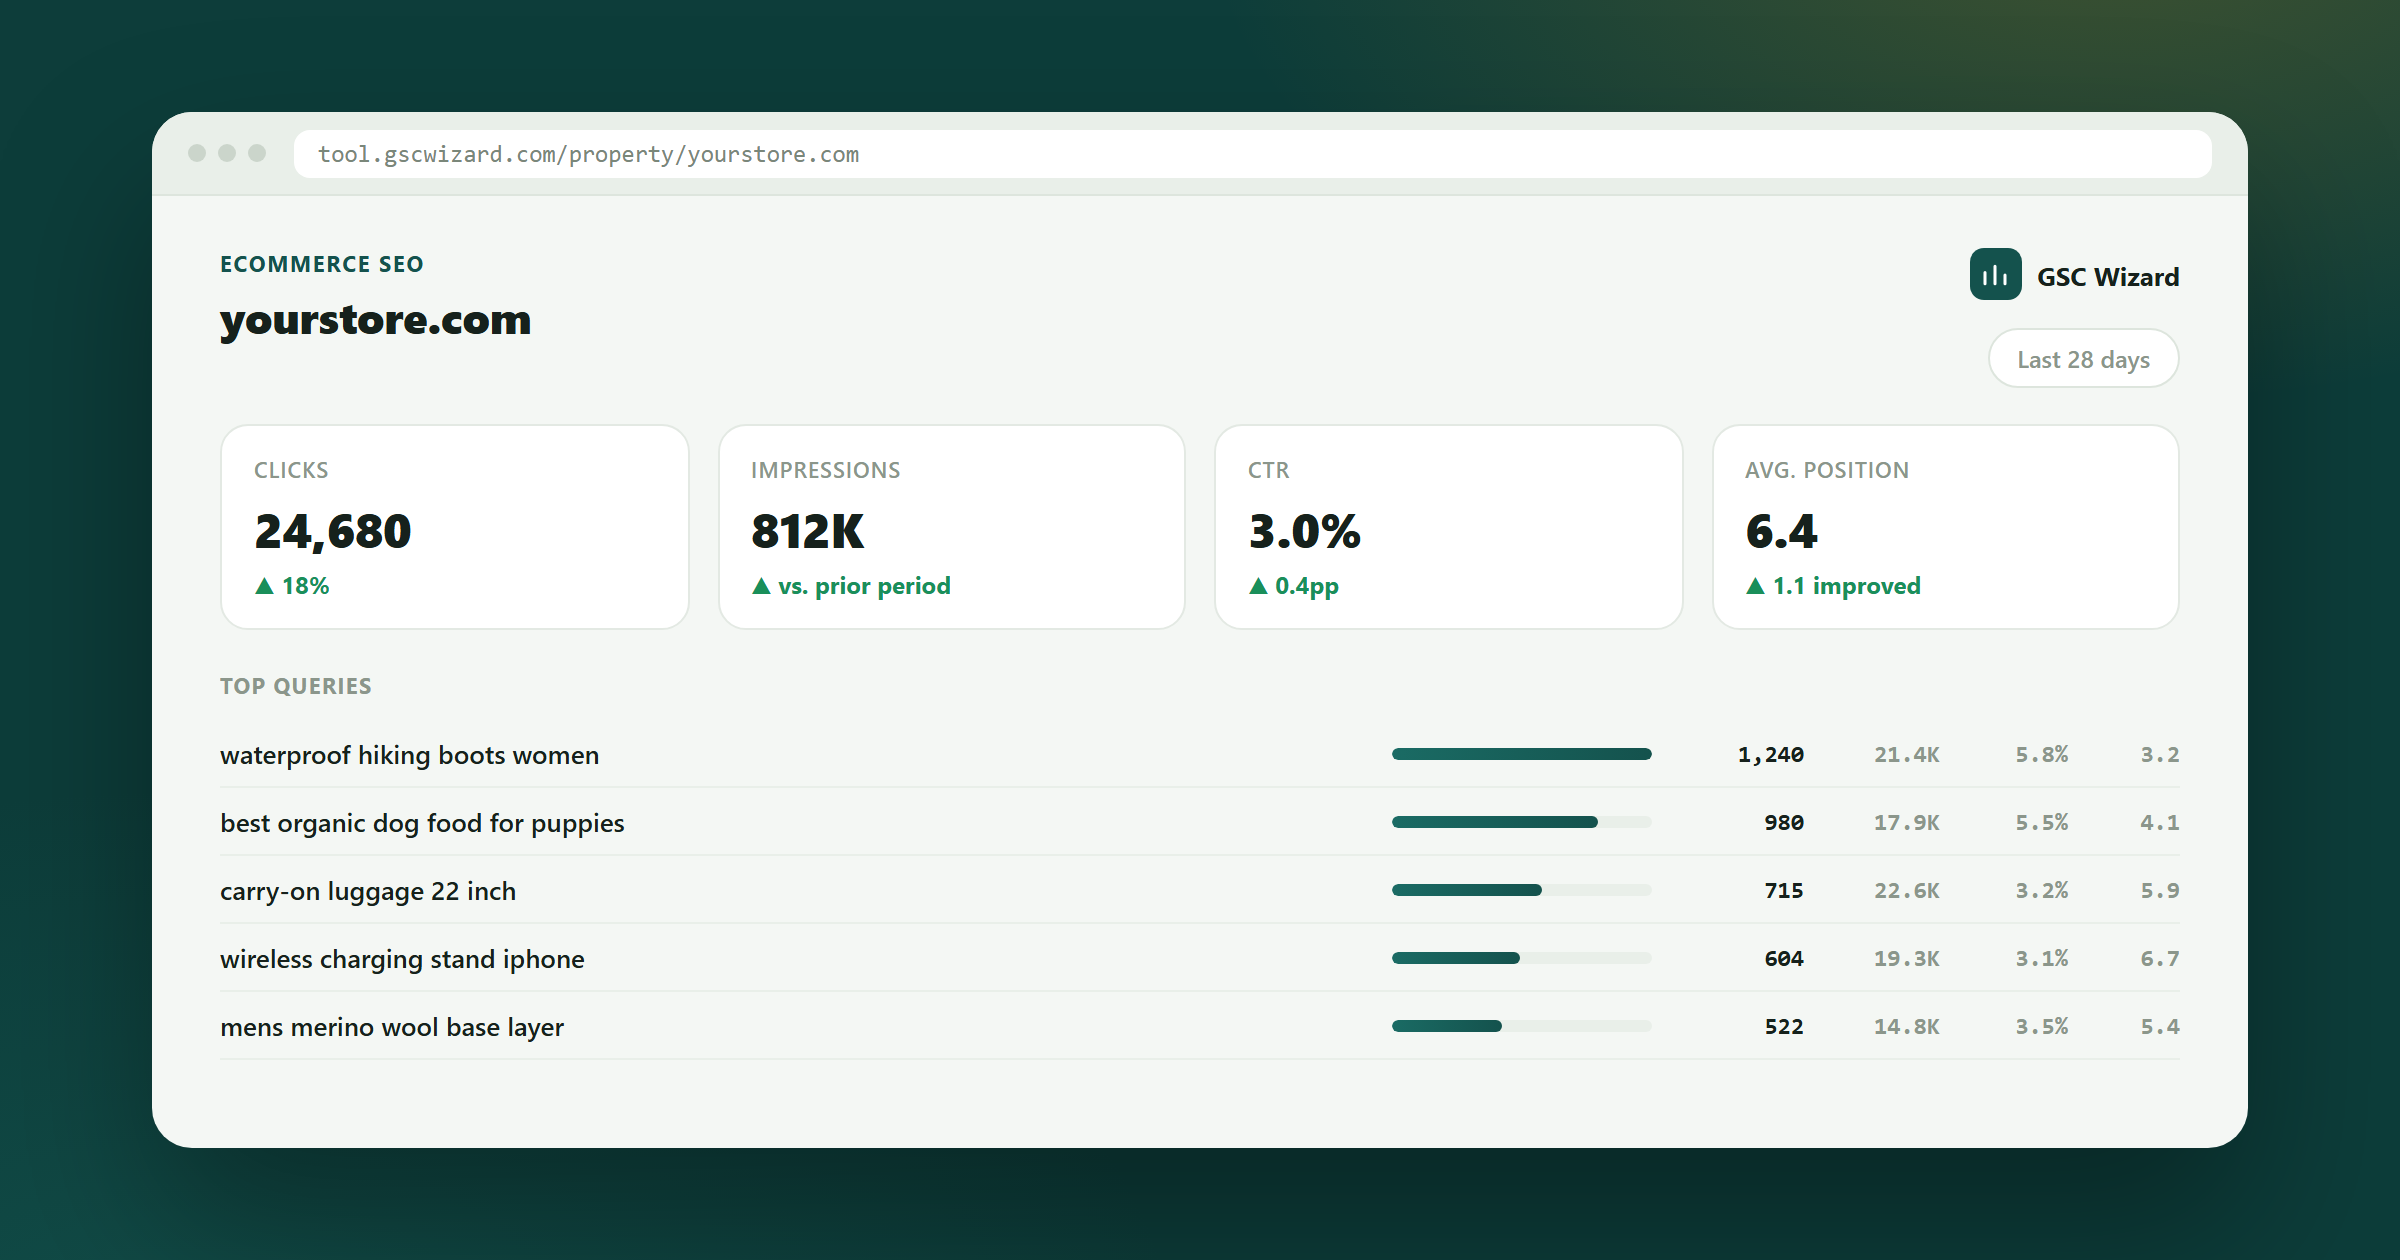
Ecommerce SEO
Your category pages carry the revenue. Your product pages carry the URL count. Report on them together and every trend line is an average of two businesses moving in opposite directions. GSC Wizard splits them, tracks each on its own baseline, and tells you which one moved.
Works with your existing Search Console property. GA4 revenue optional but worth it.
The averaging problem
Flat sitewide traffic is usually a category collapse hiding behind a long-tail product bump.
Ecommerce sites have two search businesses in one property: a few hundred category and filter pages that convert, and tens of thousands of product URLs that mostly do not. Averaged together they cancel out, and the report says 'stable' for three months while the money quietly leaves.
None of these show up as an error in Search Console. They show up as a quarter you cannot explain.
A garden-furniture category losing rank in January costs you nothing and triggers no alarm - the traffic was going to fall anyway. Then May arrives, the page is on position 11 instead of 3, and you find out during the six weeks that make the year. Decay has to be measured against the same weeks last year, not against last month.
Products come and go, but their URLs stay - soft-404s, empty variant pages, filter combinations nobody will ever search. They pile up in the index, dilute crawl budget, and drag sitewide quality signals down until Google starts leaving your new arrivals in 'Discovered - currently not indexed'.
The category page, the brand-filtered version, the colour-filtered version and three blog posts all target the same head term. Google picks a different winner week to week, average position wobbles, and no single URL ever builds enough authority to hold the top three.
Five steps, most of it once. After that the report runs itself.
Content groups turn URL patterns into reportable segments. Once /category/, /product/, filter parameters and /blog/ are separate groups, every chart splits four ways and averaging stops hiding things.
The content decay report compares performance against its own history, so a seasonal category falling out of its normal band gets flagged in the off-season - while there is still time to fix it before peak.
Cannibalization analysis groups every URL competing for the same query and shows which one Google actually picks. On ecommerce that is almost always a filter or a near-duplicate category you can canonicalise or consolidate.
GA4 connects to the same property, so landing pages carry sessions, key events and ecommerce revenue next to their Search Console clicks. A position-8 category worth 40 EUR a click outranks a position-4 blog post worth nothing.
Link the shop's Google Merchant Center account and Organic Shopping adds what Search Console cannot see: free listing clicks per product across Shopping, Images, Lens and YouTube, every product Google limits or disapproves ranked by click potential, competitor and price insights, and a monthly feed audit that compares each product page with its feed entry. Ask the same questions in Claude or ChatGPT through the Merchant Center MCP.
Scheduled, segmented, and short enough that a merchandiser will actually read it.
ECOMMERCE SEARCH REPORT - week 34 vs week 34 last year

CATEGORY PAGES        clicks -4%    revenue -11%   <- the story
PRODUCT PAGES         clicks +9%    revenue +1%
FILTER URLS           clicks +2%    revenue  0%
CONTENT / BLOG        clicks +6%    revenue +2%

DECAY - seasonal watchlist (act before peak)
  /category/garden-furniture   pos 3.1 -> 11.4   peak starts in 9 weeks
  /category/bbq-grills         pos 5.0 ->  8.2   peak starts in 7 weeks

CANNIBALIZATION - top revenue term
  'outdoor dining set'  4 URLs competing, Google picks the
  ?brand= filter 60% of the time. Canonicalise to the category.

INDEX HYGIENE
  1,240 product URLs with 0 impressions in 90 days -> prune or 410
Delivered by email, in Slack, or pulled straight into an AI agent through the MCP so it can draft the merchandising ticket for you.
Category-only click share
What share of non-branded clicks lands on pages that actually convert. If product URLs are growing their share, your traffic is getting cheaper per visit, not better.
Revenue per query, not per page
Blend GA4 key events and revenue onto landing pages so the backlog sorts by money. A term at position 8 with high average order value beats ten long-tail wins.
Seasonal position delta
Position now versus the same week last year for every seasonal category. The only decay metric that works when demand itself is seasonal.
Zero-impression URL count
Product and filter URLs indexed but never shown. The direct measure of how much crawl budget your catalogue is burning on nothing.
Search Console itself only offers page filters you have to reapply every time. In GSC Wizard you define content groups once from URL patterns - /category/, /product/, parameters, /blog/ - and every report, chart and export splits by those groups automatically, including the scheduled ones.
Yes. Connect the GA4 property for the same site and landing pages carry sessions, key events and ecommerce revenue alongside clicks, impressions and position. That turns the opportunity list from 'most impressions' into 'most money left on the table'.
That is exactly the ecommerce problem - two years back is the comparison you need and Google throws it away. Full storage properties in GSC Wizard keep up to 10 years of your Search Console data, so year-over-year and multi-year seasonal comparisons stay available after Google has dropped them.
The site health and indexing views list URLs with impressions or clicks at zero over your chosen window, so you can prune, consolidate or noindex them in batches. Cutting dead catalogue URLs is one of the few levers that lifts crawl coverage on the pages you do care about.
Written by Jan-Willem Bobbink · Published August 26, 2026
Marketplace SEO
You have four million URLs and Google indexes three hundred thousand. The question is which three hundred thousand.
Affiliate SEO
Position 3 with a bad title loses to position 5 with a good one. CTR is the affiliate's cheapest lever.
Agency SEO
The report is the product. Automate it and you get the margin back on every retainer.
Connect Search Console, split the site into content groups, and get a segmented report on Monday. Free to start, no credit card.
Practical GSC and GA4 workflows, product updates and SEO experiments. No spam, unsubscribe anytime.