Search analytics
Content Groups
Analyse Search Console performance by page groups you define, instead of one URL at a time.
Run analysis
How to run it
- Create groups in Property Setup, each with a name, colour, optional description, and URL-matching rules (an AI “suggest groups” helper can propose them from your real pages).
- Open the report and run the analysis.
What you get
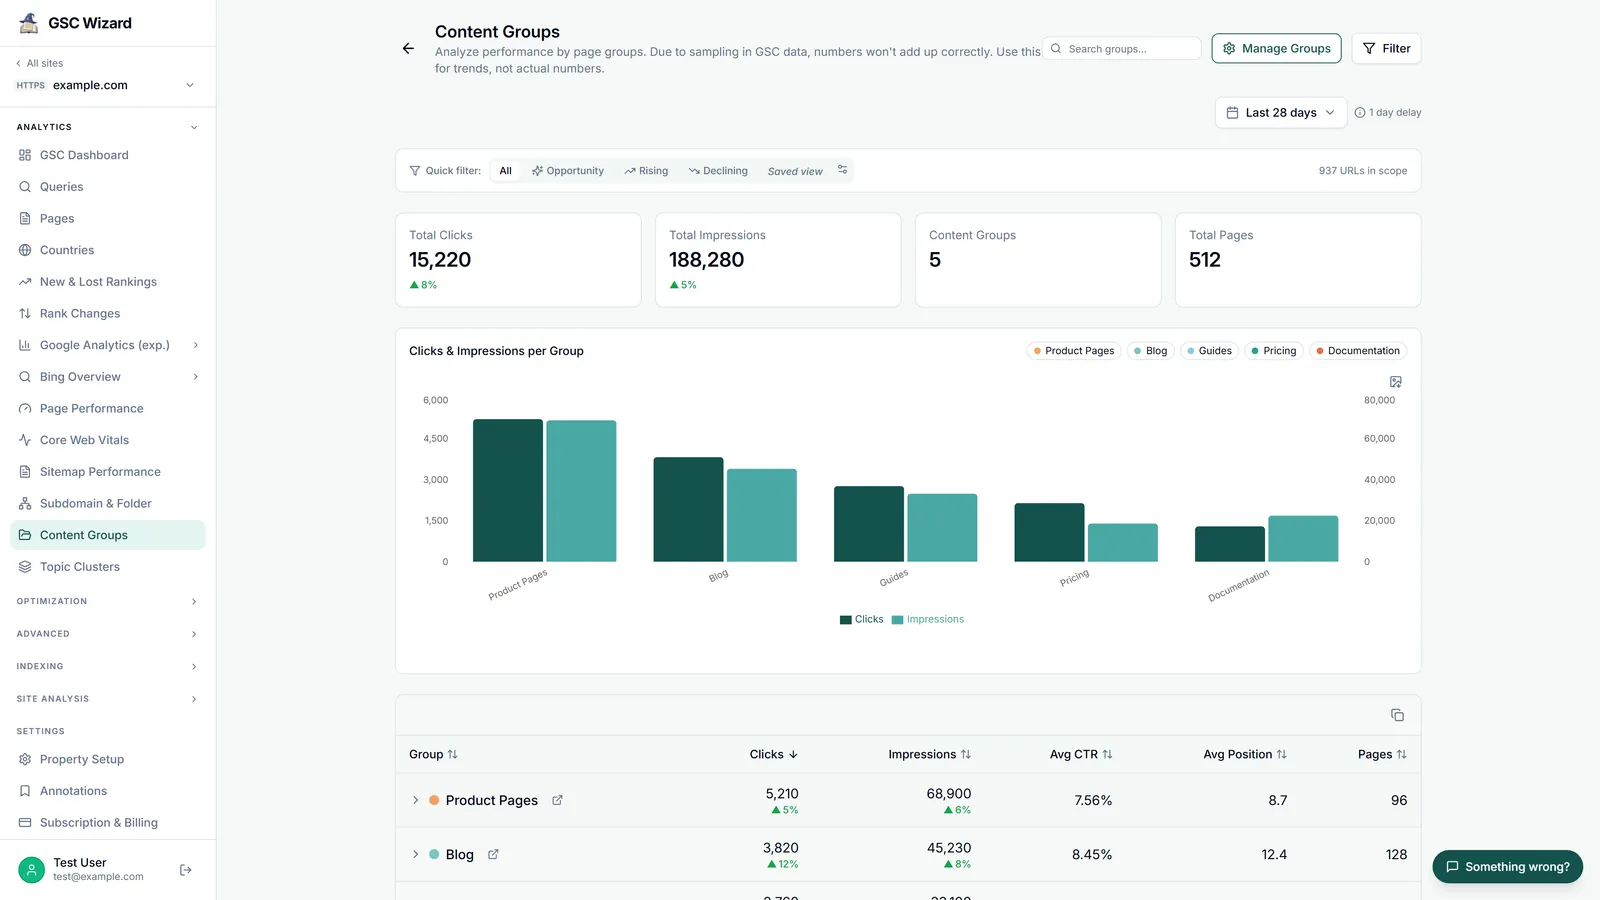
- Summary cards and a clicks-and-impressions-per-group bar chart with PNG export and per-group legend toggles.
- A sortable table (group, clicks, impressions, average CTR, average position, pages) whose rows expand to the group’s top pages.
- A link to a full per-group view, and a “performance over time” table.
- Copy table export.
Because Search Console anonymises some low-volume rows, group totals are directional rather than exact. You can also add a folder to a group directly from Subdomain & Folder.
Part of Content Groups & Topic Clusters. Related: Topic Clusters.