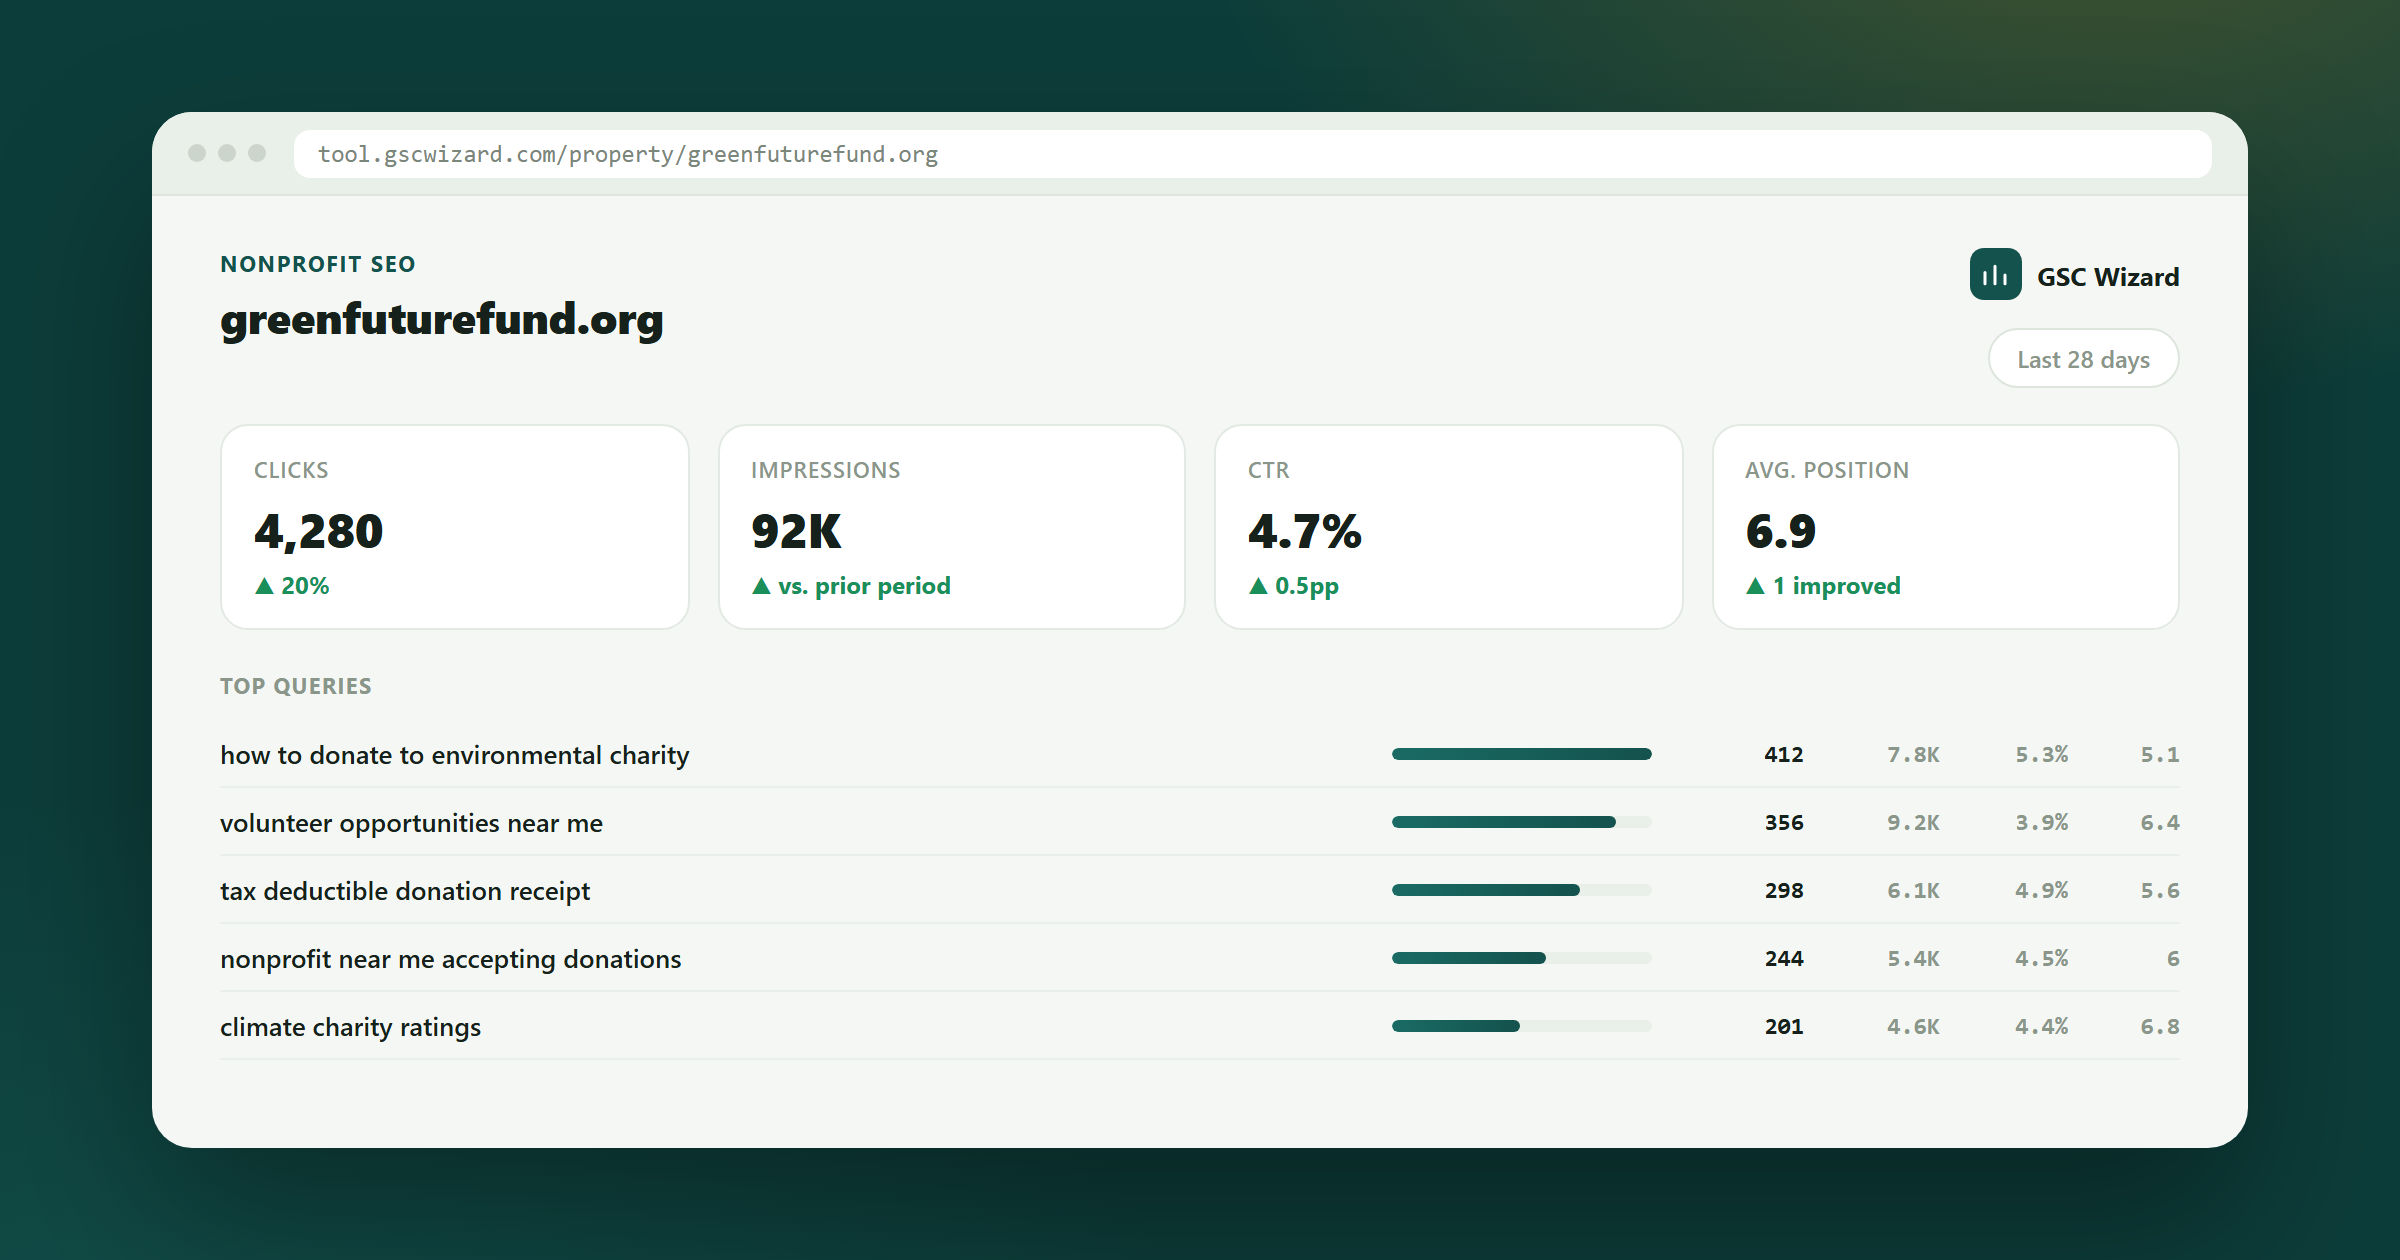
Nonprofit SEO
Nonprofit search has two audiences that share one website: people who need your services and people who might fund them. They search differently, convert differently and peak at different times. GSC Wizard separates them and gets you ready for December before November.
Works on the free tier for a single property. No analyst required.
Two audiences, one website
Service seekers and donors both land on your site, and reporting them as one number serves neither.
Someone searching for crisis support and someone searching whether your charity is legitimate before donating want completely different pages. Averaged into 'organic traffic', a collapse in service-page rankings and a strong donation season can cancel each other out entirely.
Constraints that are real: no analyst, no budget, and a season that decides the year.
A large share of annual online giving lands in December, and much of it starts with a search. If your donation pages are not ranking by November, the year is set. A monthly report delivered in January is an autopsy.
Your help pages, service directories and eligibility guides serve beneficiaries. Your about, impact and donate pages serve funders. One number for both means you can never tell which mission you are succeeding at.
The board wants to know whether the website is working. Building that from Search Console by hand takes a day nobody has, so the answer is usually a screenshot of a traffic graph with no interpretation attached.
Small setup, and most of it is free.
Group service and help content apart from about, impact and donate pages. It is a fifteen-minute setup and it is the single change that makes every later report meaningful.
Traffic forecasting projects the season from your own history, so the donation-page work happens in September rather than in a panic in the second week of December.
Query analysis shows the language beneficiaries use, which is often nothing like the language in your content. On service content this gap is a mission problem, not a marketing one.
Shared report links give the board a live view they can open themselves, so the quarterly reporting job stops being a manual build.
Run in September, about December.
NONPROFIT SEARCH REPORT - September, pre-giving season

DONOR JOURNEY PAGES        clicks   avg pos   vs last year
  /donate/                  2,140      4.1        -0.8 pos
  /about/where-money-goes/  1,880      3.2        stable
  /impact/                    920      6.4        -1.9 pos
  -> two key donor pages lost position since last December.
     10 weeks to recover before the season.

SERVICE / BENEFICIARY PAGES
  /help/                   14,200      2.8        stable
  /eligibility/             6,110      3.4        +0.4 pos
  Top beneficiary queries use 'can I get help with...'
  Our pages are titled 'Grant Application Process'. Rewrite.

SEASON FORECAST
  December donor-page traffic 8,400-11,200 clicks if positions
  recover; 5,900-7,100 if they do not. That gap is the case
  for doing the work now.
The forecast written as two scenarios is what turns an SEO report into a budget conversation a board can act on.
Donor page position, in September
Where your donate and impact pages rank going into the season. It is a leading indicator; December traffic is a lagging one.
Beneficiary query language match
Whether the words people in need actually search match the words on your service pages. Usually the highest-impact and lowest-cost finding on a charity site.
Service versus donor split
Two audiences, two trend lines. Without the split, success with one hides failure with the other.
Year-over-year season comparison
December against December. The only honest comparison in an organisation whose income is this seasonal.
Yes. The free tier covers a single property and the reports run on your existing Search Console data. The setup that matters most - separating service content from donor content into content groups - takes about fifteen minutes and costs nothing.
September at the latest. Ranking changes take weeks to take effect, so work started in December affects next year's season rather than this one. The forecast exists to make that timing concrete rather than a rule of thumb.
Read the queries, not the traffic. Query analysis shows the phrasing people actually use, and the common finding is a mismatch between plain-language searches and institutional page titles. Fixing the language is usually a same-day change.
Yes, shared report links are read-only views that stay current, so board members can open the data themselves rather than waiting for a quarterly slide.
Written by Jan-Willem Bobbink · Published August 31, 2026
Creator SEO
One hour a week, three posts refreshed. That beats publishing more, and it is the whole routine.
Education SEO
Forty departments publish independently and nobody owns the site. Report per department or not at all.
Agency SEO
The report is the product. Automate it and you get the margin back on every retainer.
Split your two audiences, forecast December, and give trustees a link that updates itself.
Practical GSC and GA4 workflows, product updates and SEO experiments. No spam, unsubscribe anytime.