SEO statistics for 2026
Most SEO statistics pages copy each other. I opened the original source behind 86 of the most quoted numbers, kept what the source actually says, and put the date the data was collected next to each one.
Last updated · Every number checked against its original source on that date
I have read the same "68% of online experiences begin with a search engine" line on hundreds of pages, so for this list I went back to every original study, report and Google document. Several of the most popular numbers turned out to be misquoted, replaced by a newer edition, or from 2017. Those are in a separate section at the bottom, with the reason I dropped them.
Each statistic below is one sentence with its source and the date the data was collected. Numbers from data older than 2023 carry an amber label, so you can decide yourself whether they still apply. I also added a note per section on how to check the number on your own site, because a third-party average is never your site.
Key takeaways
- According to SparkToro (June 2026), 68.01% of US Google searches ended without a click in January to April 2026.
- According to Statcounter (September 2026), Google had 89.94% of worldwide search engine market share and Bing 5.29%.
- According to Ahrefs (February 2026), an AI Overview correlated with a 58% lower average click-through rate for the top-ranking page.
- According to Ahrefs (October 2025), 96.98% of US desktop clicks went to the top 10 results in August 2025.
- According to HTTP Archive (August 2026), 53.0% of mobile origins and 60.2% of desktop origins passed Core Web Vitals.
- According to Ahrefs (May 2025), only 1.74% of new pages reached Google's top 10 within a year.
Search engine market share statistics
- According to Statcounter (September 2026), Google had 89.94% of the worldwide search engine market across all devices.
- According to Statcounter (September 2026), Bing was second with 5.29%, followed by Yahoo! at 1.36%, Yandex at 1.31%, DuckDuckGo at 0.74% and Baidu at 0.44%.
- Google's worldwide share moved between 89.85% (March 2026) and 91.32% (July 2026) in the 13 months to September 2026, according to Statcounter.
- According to Google (March 2025), Google handles more than 5 trillion searches a year, based on its internal data from January 2025.
- According to Google's How Search Works, 15% of the searches Google sees every day are new, a figure Google also gave in its 2019 BERT announcement.
- According to Statcounter, mobile devices produced 60.04% of worldwide web traffic in September 2026, but only 51.04% in May 2026, so "about half or more" is the honest summary of a noisy series.
Zero-click search statistics
- According to SparkToro (June 2026), 68.01% of US Google searches ended without a click in January to April 2026.
- SparkToro's 2026 figure comes from Similarweb's US panel and excludes searches in the Google app, so the real zero-click rate is probably higher.
- According to SparkToro (June 2026), only 0.34% of US Google searches continued into AI Mode in January to April 2026.
- According to SparkToro and Datos (July 2024), 58.5% of US and 59.7% of EU Google searches ended with zero clicks, based on data from September 2022 to May 2024.
- According to SparkToro and Datos (July 2024), every 1,000 US Google searches sent 360 clicks to the open web, and every 1,000 EU searches sent 374.
- SparkToro's 2026 post puts the 2024 US zero-click rate at 60.45% instead of 58.5%, because the two studies use different panels; SparkToro itself calls the comparison "a bit of apples and oranges".
- According to BrightEdge (September 2025), AI search platforms sent less than 1% of referral traffic in January to August 2025, while organic search remained the largest source.
Click-through rate (CTR) statistics
- According to Advanced Web Ranking (September 2026), the position 1 result on Google US desktop got a 20.02% click-through rate in July 2026, across more than 1.75 million SERPs a month.
- According to Advanced Web Ranking (September 2026), position 1 got 9.69% on results pages with an AI Overview, a 52% cut; positions 2 and 3 lost 64% and 56%.
- According to Advanced Web Ranking (September 2026), 74.3% of searches with an AI Overview ended without a click, against 53.6% of searches without one.
- According to Advanced Web Ranking (September 2026), AI Overviews appeared on 43% of sampled US desktop results pages in July 2026.
- According to Advanced Web Ranking (September 2026), the average position 1 CTR over the last 12 months was 20.9%, down from 28.0% in the 12 months before.
- According to First Page Sage (September 2026), position 1 got a 7.1% CTR on average: 3.6% when an AI answer was shown and 22.6% when it was not.
- According to First Page Sage (September 2026), the top 3 organic results took 77.1% of organic clicks, based on Search Console data from 1,184 client and panel domains between March and August 2026.
- According to Seer Interactive (November 2025), organic CTR on informational queries with an AI Overview fell from 1.76% in June 2024 to 0.61% in September 2025, across 3,119 queries from 42 client organisations.
- According to Seer Interactive (November 2025), organic CTR on queries without an AI Overview also fell, from about 2.7% to 1.62% over the same period.
- According to Seer Interactive (November 2025), brands cited inside an AI Overview got a 0.70% organic CTR in Q3 2025, against 0.52% for brands that were not cited.
- According to Seer Interactive (April 2026), organic CTR on AI Overview queries bottomed at 1.3% in December 2025 and recovered to 2.4% in February 2026, in a new and larger cohort of 53 brands.
- According to Ahrefs (February 2026), an AI Overview correlated with a 58% lower average CTR for the top-ranking page, comparing December 2025 with December 2023 across 300,000 keywords.
- According to Ahrefs (April 2025), the same comparison showed a 34.5% lower CTR a year earlier, using March 2025 data.
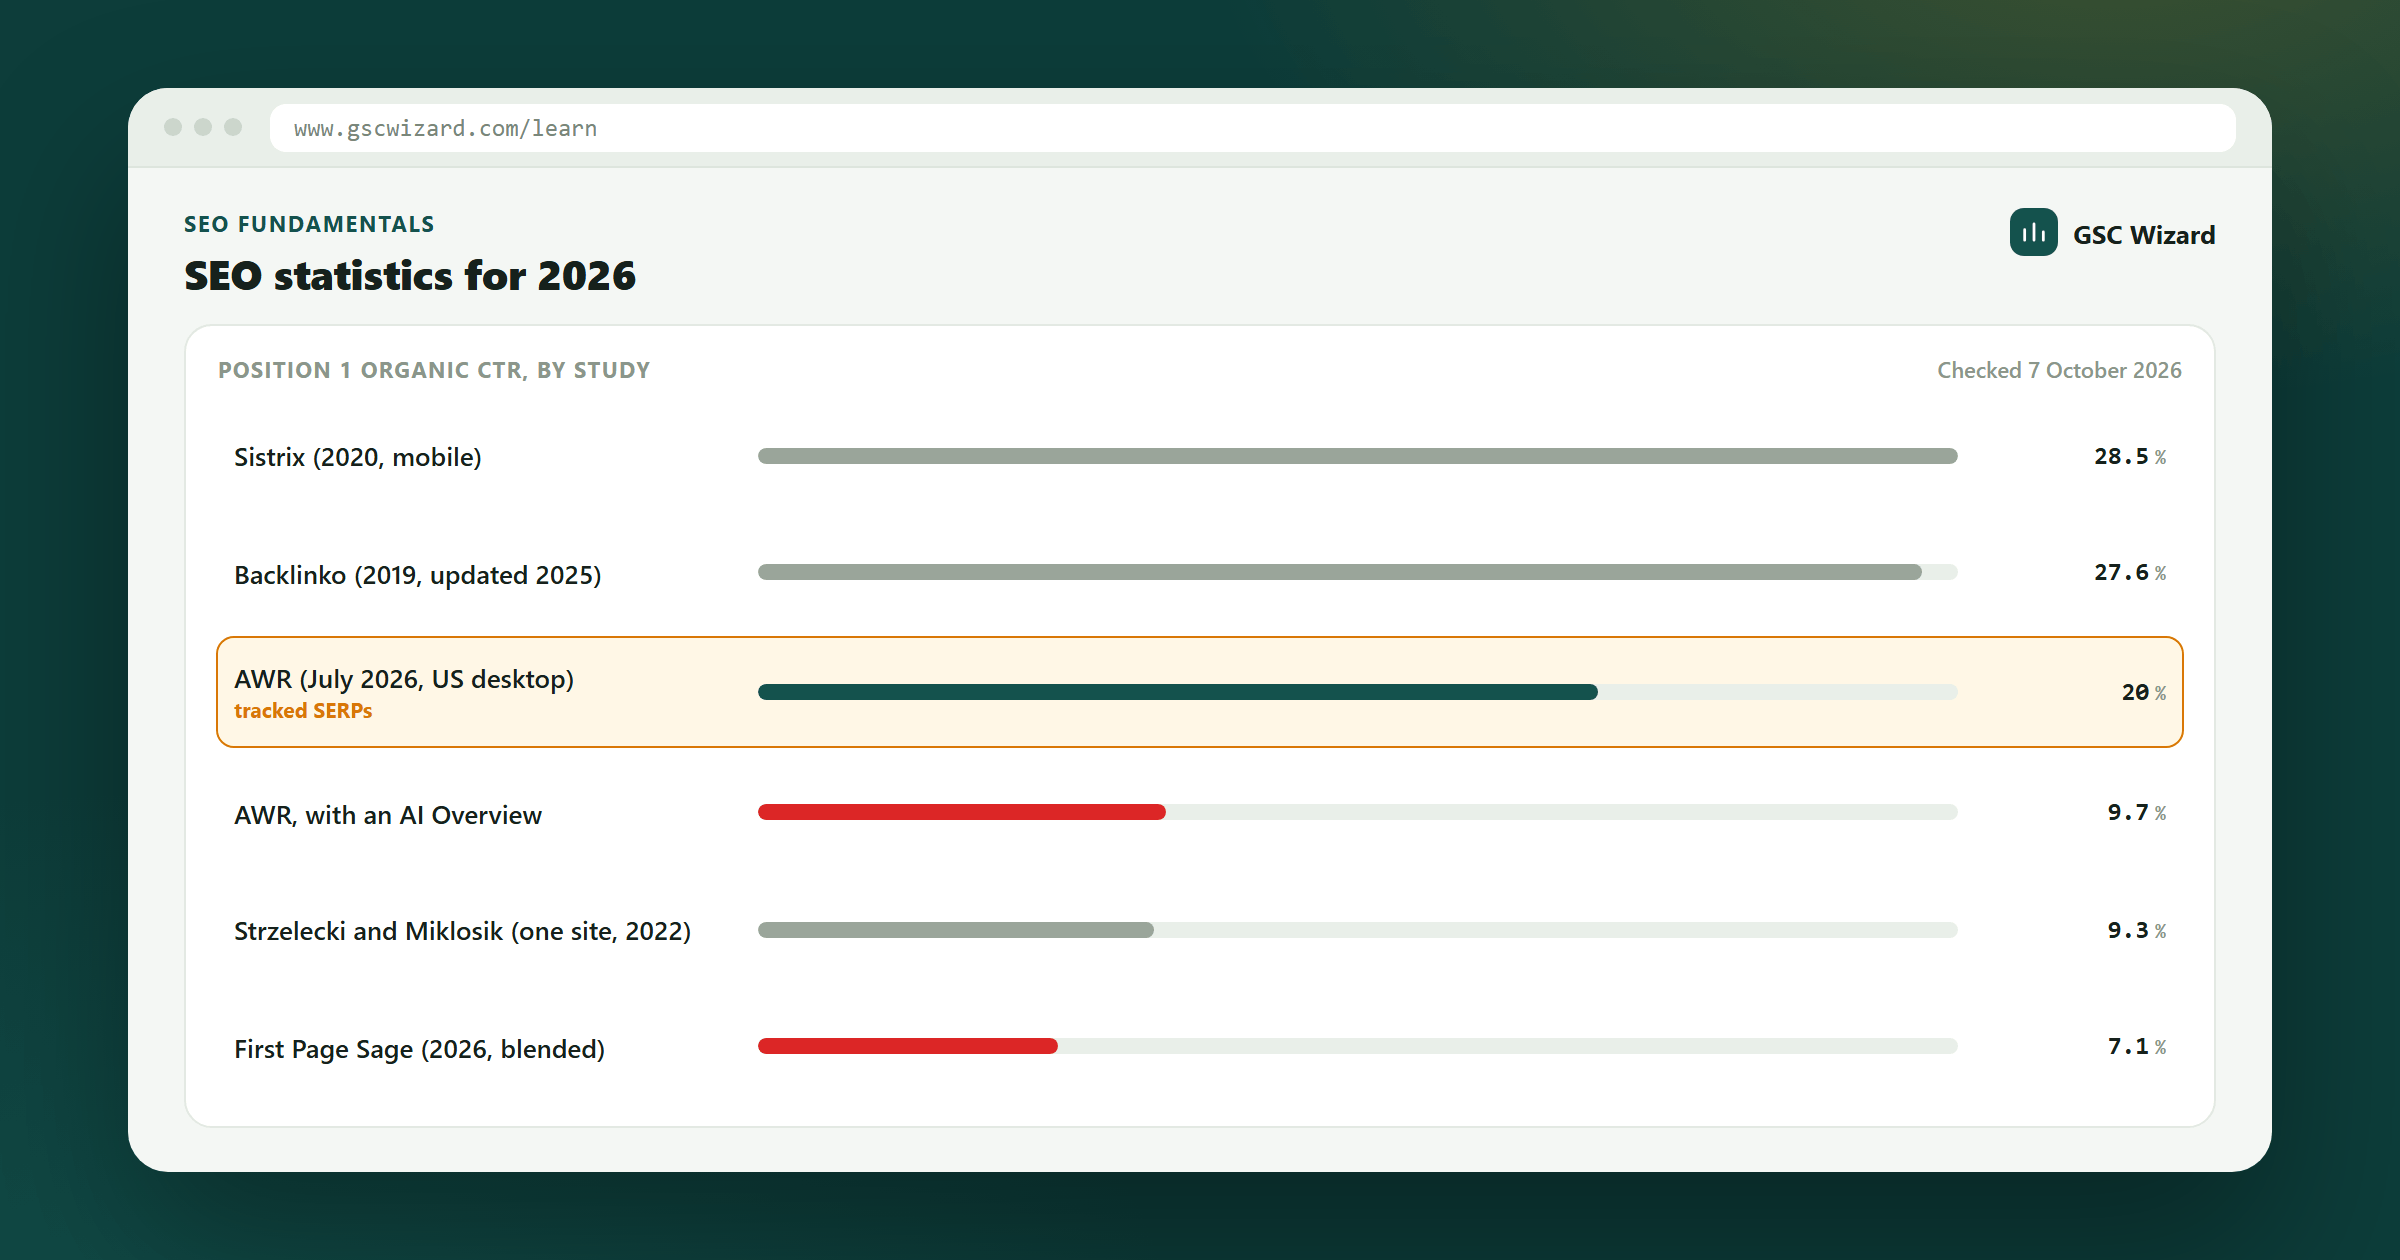
Position 1 CTR is the most quoted SEO statistic, and the studies do not agree on it within a factor of four. They measure different things: tracked results pages or averaged Search Console rows, desktop or mobile, one site or a thousand, before or after AI Overviews.
| Study | Published | Data | Position 1 CTR |
|---|---|---|---|
| Sistrix | Sep 2020 | 80M+ keywords, mobile results pages | 28.5%34.2% with no SERP features |
| Backlinko | Aug 2019, updated Apr 2025 | Search Console data for 1.3M pages, supplied by Semrush | 27.6% |
| Advanced Web Ranking | Sep 2026 | 1.75M+ US results pages a month, desktop, July 2026 | 20.0%9.7% with an AI Overview |
| Strzelecki and Miklosik | Jan 2024 | Search Console API data for one website, 2022 | 9.3% |
| First Page Sage | Sep 2026 | 1,184 client and panel domains, March to August 2026, not public | 7.1%22.6% without an AI answer |
My reading: branded queries push position 1 up and informational queries push it down, so a site's mix matters more than any of these averages. That is why I would never plan a forecast on a published CTR curve.
Google Search Console data statistics
- According to Google, Search Console keeps performance data for the last 16 months, a limit it introduced in January 2018.
- According to Google (October 2022), the Search Console interface exports at most 1,000 rows, while the Search Analytics API returns up to 50,000 rows per day, per site, per search type.
- According to Google (October 2022), Search Console hides queries that are not issued by more than a few dozen users over a two-to-three month period, to protect user privacy.
- According to Ahrefs (June 2022), 46.08% of all clicks in one month of Search Console API data from 146,741 websites went to these anonymous queries. 2022 data
- In the same Ahrefs study, the hidden share ranged from almost 0% to 100% per site, so 46.08% is a pooled figure, not what a typical site loses.
- According to Ahrefs (November 2021), Google Keyword Planner overestimated search volume 54.28% of the time compared with Search Console impressions for 72,635 keywords, and was roughly accurate 45.22% of the time. 2021 data
Ranking and content statistics
- According to Ahrefs (May 2025), only 1.74% of 1 million pages first seen in September 2023 reached Google's top 10 for any keyword within a year, down from 5.7% in its 2017 study.
- According to Ahrefs (May 2025), 72.9% of pages in Google's top 10 are more than three years old, up from 59% in 2017.
- According to Ahrefs (October 2025), 96.98% of US desktop clicks and 97.56% of US mobile clicks in August 2025 went to results in the top 10.
- According to Ahrefs (October 2025), the top 10 never took less than 95.5% of clicks in the two years before August 2025.
- According to Ahrefs (December 2023), 96.55% of the roughly 14 billion pages in its index get no traffic from Google, and 1.94% get between one and ten visits a month, based on Ahrefs' own traffic estimates.
- According to Ahrefs (updated May 2026), 92.77% of the keywords in its US database get 0 to 10 searches a month, and only 17,730 keywords (0.0007%) get more than 100,000.
- According to John McAlpin (April 2025), Google showed a different title than the page's title tag in 76.04% of 24,886 results, up from 61% in a 2023 study by Cyrus Shepard.
- According to Ahrefs (November 2021), when Google rewrote a title it took the H1 instead 50.76% of the time. 2021 data
- According to Ahrefs (2020), Google rewrote the meta description in 62.78% of 20,000 keywords' snippets. 2020 data
- According to Ahrefs (July 2025), pages cited by ChatGPT, Perplexity, Copilot and Gemini were on average 1,064 days old, against 1,432 days for Google's organic results, which makes them 25.7% "fresher".
- In the same Ahrefs study, Google's AI Overviews were the exception and cited content 16 days older than the organic results.
- According to Ahrefs (March 2019), the position 1 page got the most total search traffic for its keyword only 49% of the time, because other pages rank for more related queries. 2019 data
Google algorithm update statistics
- According to Google's Search Status Dashboard, Google confirmed three core updates in 2025 (13 March, 30 June and 11 December) and one spam update (26 August).
- According to the Search Status Dashboard, the August 2025 spam update took 26 days and 15 hours to finish rolling out.
- According to the Search Status Dashboard, Google confirmed two core updates in 2026 up to 7 October (27 March and 21 May), four spam updates (24 March, 24 June, 18 August and 24 September) and one Discover update (5 February).
- According to the Search Status Dashboard, core updates in 2025 and 2026 took between 11 days and 21 hours (May 2026) and 18 days and 2 hours (December 2025) to roll out.
Technical SEO statistics
- According to HTTP Archive (August 2026), 53.0% of 8.7 million mobile origins and 60.2% of 5.3 million desktop origins passed all three Core Web Vitals, based on Chrome UX Report data.
- According to HTTP Archive (August 2026), Largest Contentful Paint is the hardest metric on mobile: 65.8% of origins had a good LCP, against 80.1% for INP and 83.1% for CLS.
- According to the Web Almanac 2025 (January 2026), 48% of mobile websites and 56% of desktop websites had good Core Web Vitals in 2025, up from 44% and 55% in 2024.
- According to the Web Almanac 2025 SEO chapter (January 2026), 98.5% of mobile pages have a title tag, but only 67.2% have a meta description and 67% have a canonical tag.
- According to the Web Almanac 2025, robots.txt returned a 200 status on 84.9% of sites and a 404 on about 13%.
- According to the Web Almanac 2025, 43% of home pages use JSON-LD structured data.
- According to the Web Almanac 2025, 2.10% of mobile sites and 2.13% of desktop sites had an llms.txt file.
- According to Ahrefs (August 2023), 59.5% of 1,002,165 domains had at least one page with a missing or empty H1, and 51.3% had at least one page with multiple H1s.
- According to Ahrefs (August 2023), 80.4% of those domains had at least one image without an alt attribute, and 62.7% had a page linking to a redirect.
- According to Ahrefs (August 2023), 66.2% of domains had a page with only one followed internal link pointing to it.
- According to Ahrefs (August 2023), 67% of 374,756 domains using hreflang had at least one hreflang issue.
- According to WebAIM (February 2026 data), 95.9% of the top one million home pages had detectable WCAG 2 failures, with an average of 56.1 errors per page.
- According to WebAIM (February 2026 data), 53.1% of those home pages had images missing alternative text.
Link building statistics
- According to Ahrefs (December 2023), pages with more referring domains tend to get more search traffic, a correlation rather than proof of cause.
- According to Ahrefs (April 2022), at least 66.5% of the links pointing to 2,062,173 websites since January 2013 had rotted by 2022. 2013–2022 data
- According to Zyppy (July 2022), pages with at least one exact-match internal anchor had at least five times more traffic than pages without, across 23 million internal links on 1,800 websites. 2022 data
- Zyppy has since added a caveat to that study: its 2024 study of 50 sites found that sites losing traffic after Google updates tended to have more anchor text variety per page.
- According to Aira (2022), the most common answer from SEOs on how long one link takes to build was 1 to 2 hours (32%), followed by 3 to 5 hours (24%). 2022 data
- According to Ahrefs (May 2020), 10.6% of backlinks to the top 110,000 sites were nofollow, while only 0.44% of referring domains used rel="ugc" and 0.01% rel="sponsored". 2020 data
Local SEO statistics
- According to BrightLocal (February 2026), 80% of 1,002 US consumers said they are likely to use a business that responds to all of its reviews.
- According to Whitespark (November 2025), Google Business Profile signals make up 32% of the weight in local pack rankings, ahead of reviews at 20%; this is an estimate from a survey of local SEO experts, not a measurement.
- According to Google, people are 2.7 times more likely to consider a business reputable if they find a complete Business Profile on Search and Maps.
- According to Google, people are 70% more likely to visit and 50% more likely to consider buying from a business with a complete Business Profile.
- According to Think with Google (May 2016), 76% of people who searched on their smartphone for something nearby visited a related business within a day, and 28% of those searches ended in a purchase. 2016 data
AI and content statistics
- According to Ahrefs (May 2025), 74.2% of 900,000 new English-language pages first seen in April 2025 contained AI-generated content: 71.7% mixed and 2.5% purely AI.
- According to Ahrefs (June 2025), 87% of 879 marketers surveyed use AI to create or help create content.
- According to Ahrefs (June 2025), 65% of those marketers rated human-written content as better quality, 14% said AI content was better and 21% saw no difference.
- According to HubSpot (2026), 80% of marketers use AI for content creation and 75% use it for media production.
- According to Ahrefs (June 2025), Google sent 210 times more traffic than ChatGPT, Perplexity and Gemini combined across 81,947 websites, down from 345 times in March 2025.
- According to the Web Almanac 2025, 4.2% of mobile sites name GPTBot in their robots.txt.
- According to the Reuters Institute (February 2024), 48% of the most-used news websites in ten countries blocked OpenAI's crawlers at the end of 2023, and 24% blocked Google's AI crawler.
SEO industry and marketing statistics
- According to Ahrefs (November 2024), the median SEO salary was $58,288 in 2024, up from $49,211 in 2023, in a survey of 234 SEOs of whom 67% were based in the UK.
- According to Ahrefs (November 2024), in-house SEOs had the highest median salary at $57,737, ahead of self-employed SEOs at $46,436 and agency SEOs at $44,762.
- According to Ahrefs (November 2024), SEO Directors had about 13 years of experience on average and Heads of SEO about 10.
- According to Ahrefs (survey of 439 SEOs, November 2022), 78.2% of SEOs charge monthly retainers, and $501 to $1,000 a month is the most common retainer (20.4%). 2022 data
- According to the same Ahrefs survey, SEOs serving a worldwide market charged $3,473.74 a month on average, against $1,557.08 for those serving a local market. 2022 data
- According to Wyzowl (2026), 91% of businesses use video as a marketing tool, in a survey of 266 marketers and consumers from late 2025.
- According to Wyzowl (2026), 63% of video marketers have used AI video tools, up from 51% a year earlier.
Statistics I left out, and why
These numbers show up on most SEO statistics pages. None of them survived a check against the source.
- "68% of online experiences begin with a search engine." BrightEdge's 2019 report says 68% of trackable website traffic came from organic and paid search combined. That is a different claim, measured in May 2019.
- "SEO drives 1,000% more traffic than organic social." The same 2019 report: organic search sent 53.3% of traffic and organic social 4.7%. Seven years old.
- "5.7% of new pages reach the top 10 within a year." That is Ahrefs' 2017 figure. Its 2025 study puts it at 1.74%, and the old URL now redirects there.
- "94.74% of keywords get 10 searches a month or fewer." No longer on the Ahrefs page it is attributed to, which now says 92.77%.
- "Google sends 345x more traffic than AI chatbots." March 2025. Ahrefs' June 2025 follow-up says 210x, and the gap keeps closing.
- "Position 1 gets a 39.8% CTR." First Page Sage's own report now calls that last year's number. Its 2026 figure is 7.1%.
- "Position 1 gets a 31.7% CTR" (Backlinko). That figure is not on Backlinko's current page, which shows 27.6%.
- "88% of sites have HTTP to HTTPS redirect issues." In Ahrefs' study this is a notice that a site redirects to HTTPS, and the author's comment on it is "If you see this, great!"
- "33% of websites pass Core Web Vitals." 2021 data, measured before INP replaced FID. The August 2026 figure is 53% on mobile.
- "Google's index holds 400 billion documents." This comes from a question a DOJ lawyer put to Google's Pandu Nayak in the 2023 antitrust trial, about 2020. His answer was "I don't know the specific number, but maybe."
- "Writing jobs dropped 33% since ChatGPT." Bloomberry measured Upwork freelance postings between November 2022 and February 2024, not writing jobs in general.
- "58% of businesses do not optimise for local search." A ReviewTrackers survey from November 2021.
How these numbers were checked
On 7 October 2026 I opened the original source behind every statistic on this page: the study, report, Google document or dataset itself, not a roundup that quotes it. Where a page was summarised by a tool, I went back to the raw HTML or PDF and read the number from the table, because summaries misread tables more often than you would think.
For each number I recorded the publisher, the publication date, the period the data covers and the sample, and I kept the source's own wording where it matters ("correlated with" is not "caused"). Where a publisher has a newer edition, I used the newest one. Most studies here come from vendors who sell the metric they measured, Ahrefs included, so read them as direction rather than law. The only data that describes your site is your own Search Console data.
Spotted a number that has changed since? Tell me through the feedback page and I will update it.
Next up: AI search statistics for 2026. The numbers on AI Overviews, AI Mode, ChatGPT and AI referral traffic, checked the same way.
Written by Jan-Willem Bobbink · Published October 7, 2026