Advanced analysis
CTR Curve Modeling
Score every query against the click-through rate you would expect for its position.
Run analysis
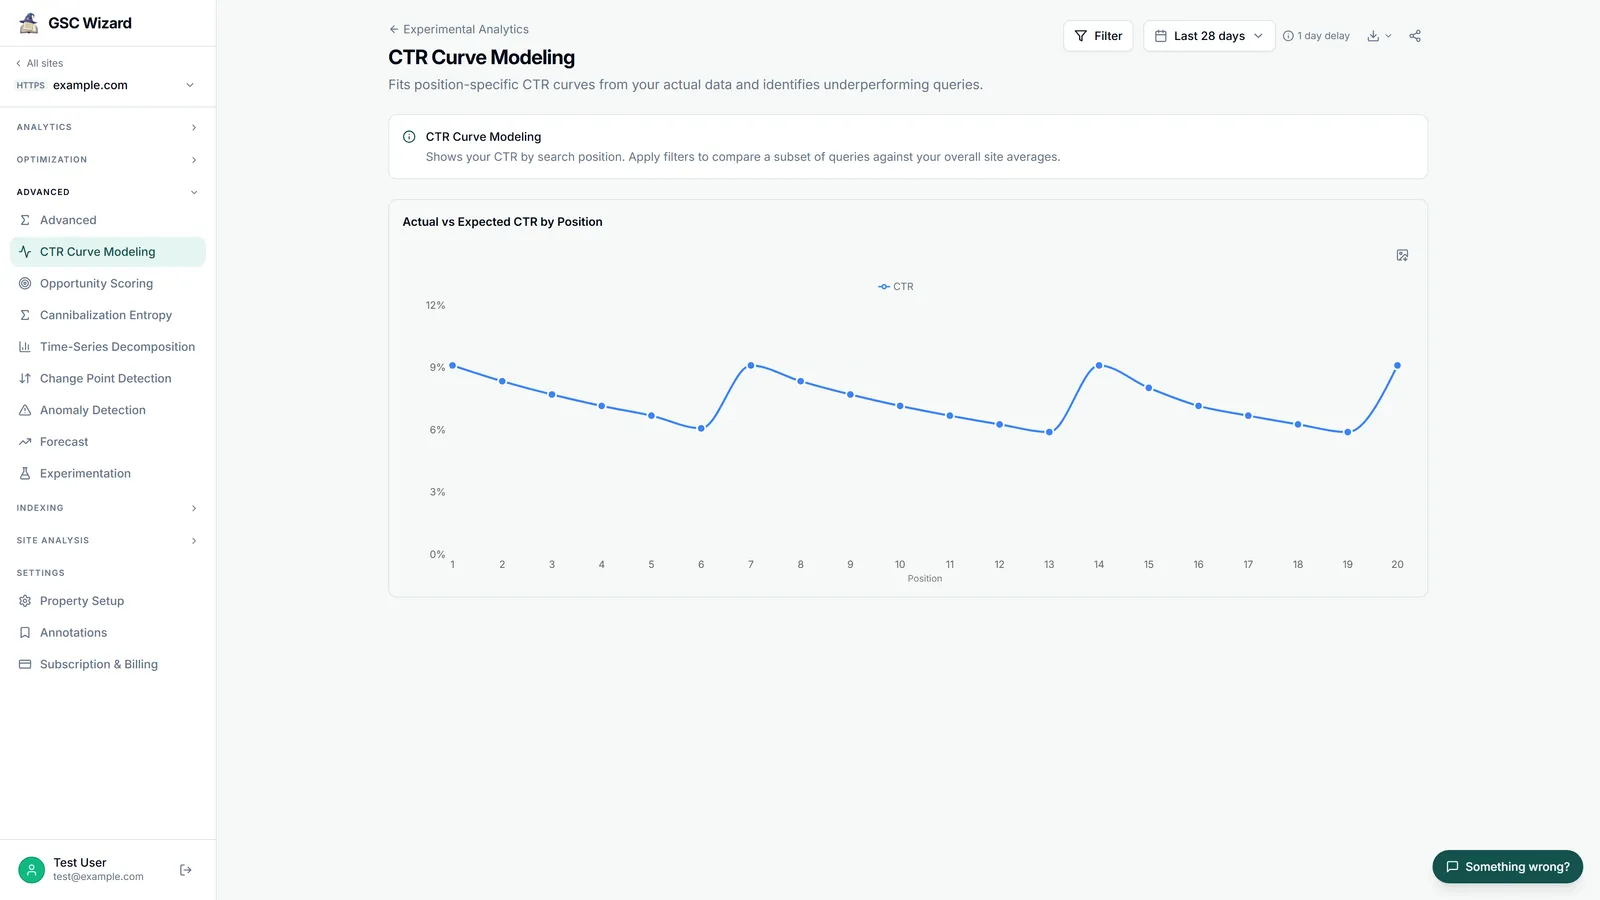
The tool builds an average CTR-by-position curve (positions 1–20), then compares a filtered set of queries against your site average as the “expected” CTR and computes a z-score per position. Queries sitting well below the curve surface as optimisation priorities.
What you get
- An actual-vs-expected CTR line chart and a per-position CTR-gap bar chart.
- An under-performers table with each query’s actual vs expected CTR, the gap, and impressions (10+ impressions required).
- Time-period, filter, and branded-keyword controls, plus export.
Part of Advanced analysis. Related: Opportunity Scoring, CTR Benchmark.