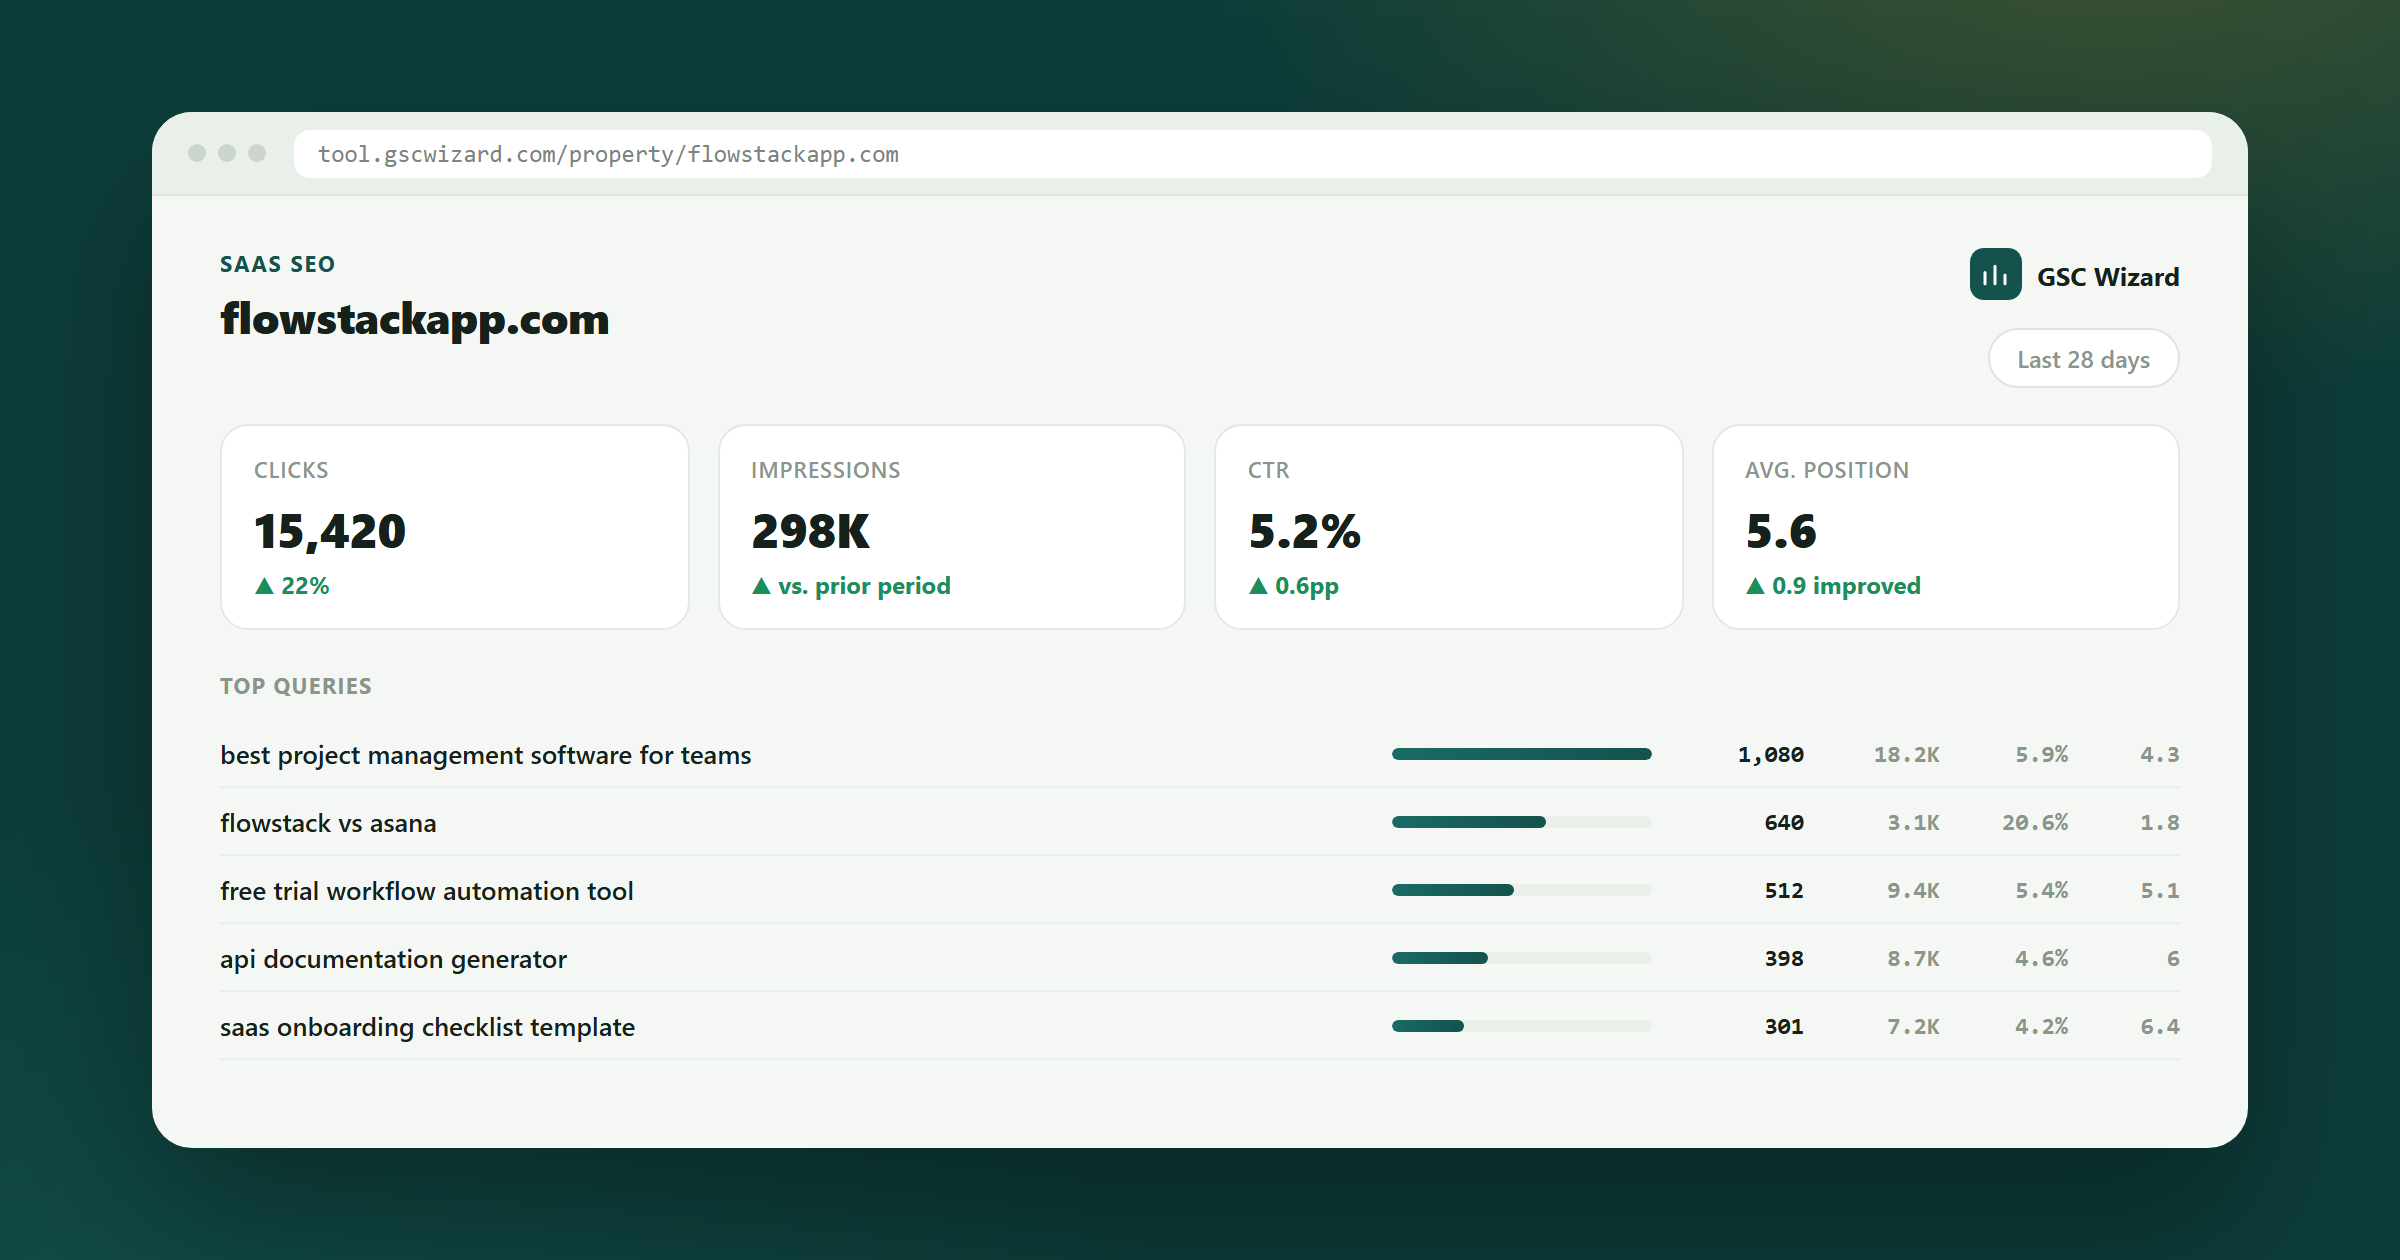
SaaS SEO
Most SaaS SEO reports celebrate blog sessions and quietly ignore that nobody signed up. GSC Wizard splits your search traffic by funnel stage - informational, comparison, branded, bottom-of-funnel - and attaches GA4 signups, so the board deck shows pipeline instead of pageviews.
GA4 key events blended onto Search Console landing pages.
The vanity trap
A million blog sessions and forty trials is not an SEO programme. It is a content habit.
Top-of-funnel content is easy to rank and easy to report. Comparison pages, alternatives pages and integration pages are harder, smaller, and worth ten to a hundred times more per visit. If your report does not separate them, you will keep funding the wrong half.
Three specific failures, all fixable with segmentation.
You run a webinar, get a podcast mention, ship a product launch - branded search rises and total clicks look great. Non-branded search, the part SEO actually controls, may have been flat or falling for two quarters underneath it.
The '{competitor} alternative' and 'X vs Y' pages sit closest to the purchase decision and usually get written once and never touched. They are also the pages competitors attack first. Nobody notices when they slip because they were never a big number.
Help centre articles outrank the feature page they are meant to support. The visitor lands in the docs, sees a configuration screen, and leaves. It reads as fine traffic in Search Console and as a bounce in GA4.
Stage first, intent second, money third.
Content groups for /blog/, /compare/, /alternatives/, /integrations/, /pricing/ and docs turn one traffic line into five that behave differently and deserve different budgets.
Branded performance reporting separates the queries containing your name from everything else, so a launch spike stops flattering the non-branded trend you are actually accountable for.
Query shape analysis buckets your terms - question, comparison, transactional, navigational - so you can see whether the intent mix of your traffic is moving toward or away from purchase.
GA4 key events blend onto landing pages next to clicks and position, so 'best CRM for agencies' at 200 clicks and 14 trials outranks a 20,000-session listicle in the backlog.
The version you can put in front of a CEO without a translation layer.
SAAS SEARCH REPORT - month to date

FUNNEL STAGE       clicks     signups    clicks/signup
  Blog (TOFU)      184,300        62         2,973
  Comparison        11,940       284            42
  Alternatives       6,210       198            31
  Integrations       9,880       141            70
  Pricing            4,050       390            10

BRANDED SPLIT
  Branded          52,100  +34%   (product launch, not SEO)
  Non-branded     164,280   -6%   <- the actual trend

BOTTOM-OF-FUNNEL WATCHLIST
  /alternatives/competitor-b   pos 2.4 -> 6.1   -71 signups/mo
  /compare/us-vs-competitor-c  pos 5.5 -> 8.9   -22 signups/mo

INTENT MIX  comparison queries 8.1% of clicks (was 11.4% in Q1)
Two numbers change the conversation: clicks per signup by stage, and the non-branded line sitting underneath the branded one.
Non-branded click trend
The only search number a marketing team genuinely controls. Report it separately or branded noise will mask two quarters of decline.
Clicks per signup by stage
Blog traffic might need 3,000 clicks per trial while a comparison page needs 40. That ratio decides where the next content hire should point.
Bottom-of-funnel position
Average position across comparison, alternatives and pricing pages only. Small pages, huge revenue leverage, usually unmonitored.
Intent mix drift
The share of clicks coming from comparison and transactional queries. When it falls, you are winning more readers and fewer buyers.
Branded performance reporting classifies queries containing your brand and its variants and reports them apart from the rest, on every chart and in scheduled reports. It is the fastest way to stop a launch spike from covering a non-branded decline.
Connect GA4 and key events blend onto Search Console landing pages, so each page carries clicks, position, sessions and conversions together. Query-level attribution is inferred through the landing page, which in practice is enough to sort a backlog by value.
Add it as a property or group it separately, then run cannibalization analysis across both. It is a common SaaS finding: the help article outranks the feature page for the feature's own name, and one canonical or internal-link fix recovers the conversion path.
Yes. The GSC Wizard MCP exposes the same reports to ChatGPT, Claude and other MCP clients, and the Slack and Microsoft Teams integrations post scheduled summaries into a channel so growth updates land where the team already is.
Written by Jan-Willem Bobbink · Published August 27, 2026
Industrial SEO
Nine clicks a month can be a six-figure order. Clicks are the wrong unit for industrial search.
Enterprise SEO
Replatforming is the biggest risk on your roadmap. Measure the migration URL by URL, not by a traffic graph.
Agency SEO
The report is the product. Automate it and you get the margin back on every retainer.
Split your search traffic by funnel stage and attach GA4 signups. Free to start, no credit card.
Practical GSC and GA4 workflows, product updates and SEO experiments. No spam, unsubscribe anytime.