You get more than 1,000 rows out of Google Search Console by going around its interface: the Search Analytics API returns up to 25,000 rows per request and pages further with startRow, the Looker Studio connector reads the same API, and the bulk data export to BigQuery sends every row except anonymized queries, though only from the day you switch it on. The 1,000-row cap belongs to the interface and its export button, and Google says so in as many words: "The maximum you can export through the Search Console user interface is 1,000 rows of data."
The Crawl Stats report is the exception that brings a lot of people to this question, and the honest answer there is less pleasant. Crawl Stats has no API at all, because the Search Console API only covers Search Analytics, Sitemaps, Sites and URL Inspection, so no tool can pull its example URLs out in full. For crawl data beyond those examples you need your own server log files, and for Bing you can use the crawl data in the Bing Webmaster Tools API. Both are covered below, together with how I get past the limit in GSC Wizard and where it stops.
Where the 1,000-row limit applies, and where it doesn't
The cap only bites on tables that list queries or URLs. For requests without a query or URL dimension, such as countries, devices and search appearance, Google writes that "Search Console will display and export all the data". The chart totals at the top of the Performance report are also complete: anonymized queries are left out of every table, but Google notes that "they are included in chart totals, unless you filter by query", which is why the rows of a table rarely add up to the number above it.
| Where in Search Console | What Google documents | How to get more |
|---|---|---|
| Performance report table and its export (queries, pages) | At most 1,000 rows through the interface | Search Analytics API, Looker Studio connector, BigQuery bulk export |
| Performance report: countries, devices, search appearance, chart totals | All data is displayed and exported | Nothing needed |
| Page indexing: example URLs per issue | Limited to 1,000 rows and not guaranteed to list every affected URL | Filter by sitemap for a different example list per sitemap; URL Inspection API for single URLs |
| Crawl Stats: example URLs per response, file type, purpose and Googlebot type | A representative sample, "not comprehensive"; no API | Export each slice, repeat over time, read your server logs |
| Search Analytics API and Looker Studio connector | 25,000 rows per API request; about 50,000 rows per day per site per search type | Query one day at a time; BigQuery bulk export for the rest |
| Bulk data export to BigQuery | Not affected by the daily row limit; anonymized queries excluded | Only covers days after setup; use the API for older data |
For step-by-step instructions on each route, see how to export Search Console data, the bulk data export to BigQuery and what the Crawl Stats report shows.
Search Analytics API: 25,000 rows per request, paged with startRow
The Search Console API is the standard way past 1,000 rows. Its rowLimit parameter has a valid range of 1–25,000 and defaults to 1,000, so a script that leaves it out gets exactly the same 1,000 rows as the interface. To go further you repeat the same request with startRow raised by 25,000 each time, and Google's guide tells you to keep going "until you reach the last page (a response with 0 rows)".
POST https://www.googleapis.com/webmasters/v3/sites/sc-domain%3Aexample.com/searchAnalytics/query
{
  "startDate": "2026-10-01",
  "endDate": "2026-10-01",
  "dimensions": ["query", "page"],
  "type": "web",
  "rowLimit": 25000,
  "startRow": 25000
}
Paging does not give you every row a large site has, though. Google's documentation says the method "exposes a maximum of 50K rows of data per day per search type (web, image, and so on--sorted by clicks)", and its performance data deep dive adds that this limit "may not be reached in all cases". Because results are sorted by clicks, what falls off is the long tail of queries and pages with few or no clicks. Anonymized queries, the ones not issued by more than a few dozen users over two to three months, never appear in any row at all. Google also warns that when you group by page or query "our system may drop some data" to keep the calculation within reasonable time and resources.
The limit counts per day of data, which is why Google recommends running one query per day for one day's worth of data, per search type (web, image, video, news, Discover and Google News each need their own request). A 30-day range fetched as 30 single-day requests can return far more rows than one request for the whole month. Quotas rarely get in the way of that: Search Analytics allows 1,200 queries per minute per site and per user, and 40,000 per minute and 30,000,000 per day per Cloud project. The quota that does bite is the load quota, measured in 10-minute and daily chunks, and Google is explicit that queries grouped or filtered by both page and query string are the most expensive, and that a six-month range costs much more than a one-day range.
Bulk data export to BigQuery: every row, from the day you switch it on
The bulk data export schedules a daily dump of your performance data into a Google BigQuery project. Google describes it as including "all the performance data available to Search Console for your property, with the exception of anonymized queries", and its launch post says plainly that "the bulk data export is not affected by the daily data row limit". You get three tables: searchdata_site_impression (aggregated by property), searchdata_url_impression (aggregated by URL) and an ExportLog of successful exports. Only property owners can set it up.
There are two catches. The first is that it starts from zero: the first export happens up to 48 hours after setup and "includes data for the day of the export", and for anything older Google's own advice is to "use the Search Console API or the reports". So the 16 months Search Console already holds have to come from the API, and every day you wait is a day the export will never have. The second is cost: you need a Google Cloud project with billing enabled, and Google writes that "Data is subject to Google Cloud storage and query costs, but there is a free usage level." Data accumulates forever unless you set a partition expiration, so storage grows every day. Google's own launch post also points out that the export is mainly for large sites, and that "Small and medium sites already have access to all their data through the user interface, the Looker Studio connector (formerly known as Data Studio) or the Search Analytics API."
How do I get more than 1,000 rows out of the crawl stats report?
You can't get a complete list out of it, and it helps to know why before trying workarounds. The Crawl Stats report (Settings > Crawl stats, available only on domain properties and root-level URL-prefix properties) shows totals for crawl requests, download size and response time, and lets you click into each response code, file type, crawl purpose and Googlebot type to see example URLs. Google describes those examples as follows: "Example URLs are not comprehensive, but just a representative example. If you don't find a URL listed, it doesn't mean that we didn't request it." Google's help page gives no row count for these lists, but in the interface the example table and its export stop at 1,000 rows, the same cap Google documents for the Page indexing examples, and the export only contains the chart and the table you are looking at.
There is also no API to go around the interface with. Google's API reference lists four services, Search Analytics, Sitemaps, Sites and URL Inspection, and Crawl Stats is not one of them. That means no third-party tool, mine included, can pull Google's crawl stats for you. What does work:
- Read your server log files. They are the only complete record of what Googlebot requested, with every URL, status code, timestamp and user agent. Verify that a request really came from Google before counting it: Google's common crawlers resolve to
crawl-***-***-***-***.googlebot.comorgeo-crawl-***-***-***-***.geo.googlebot.com, and Google publishes their IP ranges ascommon-crawlers.json. Expect small differences from the report, since Google notes that Crawl Stats "currently reports most crawl requests, but some requests might not be counted". - Export every slice separately. Each row of the response, file type, purpose and Googlebot type tables has its own example list, so exporting the 404 row, the 301 row, the HTML row, the refresh row and so on gives you several different sets instead of one. On a domain property you can also click a host to open a report scoped to that child domain, although Google only lists the top 20 child domains that received traffic in the past 90 days.
- Export on a schedule and merge. Google says the number of examples "can be weighted by day" and that this "should balance out over time", so the sample shifts. Exporting the slices you care about every week and removing duplicates builds a list much longer than any single export, which is my workaround rather than anything Google documents.
- Inspect the URLs you care about. The URL Inspection API returns
lastCrawlTimeandcrawledAsfor a single URL, within a quota of 2,000 inspections per day and 600 per minute per site. That won't replace crawl stats, but it answers "when did Google last crawl this page" for your key templates. - Use Bing's crawl data alongside it. Bing Webmaster Tools does expose crawl data through its API:
GetCrawlStatsreturns daily counts of crawled pages, 2xx, 301, 302, 4xx and 5xx responses, pages blocked by robots.txt, DNS failures and connection timeouts, andGetCrawlIssueslists the URLs with crawl issues. That is Bingbot rather than Googlebot, but a broken redirect chain or a run of 404s that Bingbot hits is usually there for Googlebot too. I compare the two tools in Bing Webmaster Tools vs Google Search Console.
The Looker Studio connector has the same limit as the API
The Search Console connector for Looker Studio is a convenient way past 1,000 rows without writing code, but it is not a way past the API's limits. Google's deep dive states that the upper limit "for the data exported through the Search Analytics API (and through the Looker Studio connector) is 50,000 rows per day per site per search type". The connector offers a Site Impression table and a URL Impression table, and one data source can only use one of them, so a report that needs both aggregations needs two data sources. Google's documentation now notes that "Looker Studio is now called Data Studio", so you may see either name.
The ways to get more rows, side by side
| Method | Rows | History | Cost and effort |
|---|---|---|---|
| Interface export | 1,000 per table | 16 months | Free, one click |
| Search Analytics API | 25,000 per request; about 50,000 per day per search type | 16 months | Free within quota; needs a script |
| Looker Studio connector | Same as the API | 16 months | Free; no code |
| BigQuery bulk export | Every row except anonymized queries | From setup onward, kept until you delete it | Google Cloud costs above the free level; SQL |
| GSC Wizard | What the API returns, fetched day by day and stored | 16 months backfilled on full storage, then growing up to 10 years | Paid plans from €17/month, 7-day free trial |
None of these routes covers the Crawl Stats report, because none of them can: the data simply is not available outside the interface.
How GSC Wizard gets past 1,000 rows
GSC Wizard reads Search Console through the same Search Analytics API, so it cannot see anything Google keeps back, but it does the paging and the storing for you. On a property connected through the API, the full Queries and Pages tables page through Google's results 25,000 rows at a time, up to 500,000 rows, instead of stopping at 1,000. On a full storage property, I backfill the last 480 days (about the 16 months Google holds) into a warehouse and then add each new day as it comes in. Each day is requested separately, the way Google recommends, for web, image, video, news and Discover, and for queries, pages, countries and devices plus their pairings (page by query, country by query, device by query, country by page and device by page), and every row Google returns is kept. On one large property in the warehouse, a single day in September 2026 holds 37,601 distinct queries, which no 1,000-row export of that day comes close to.
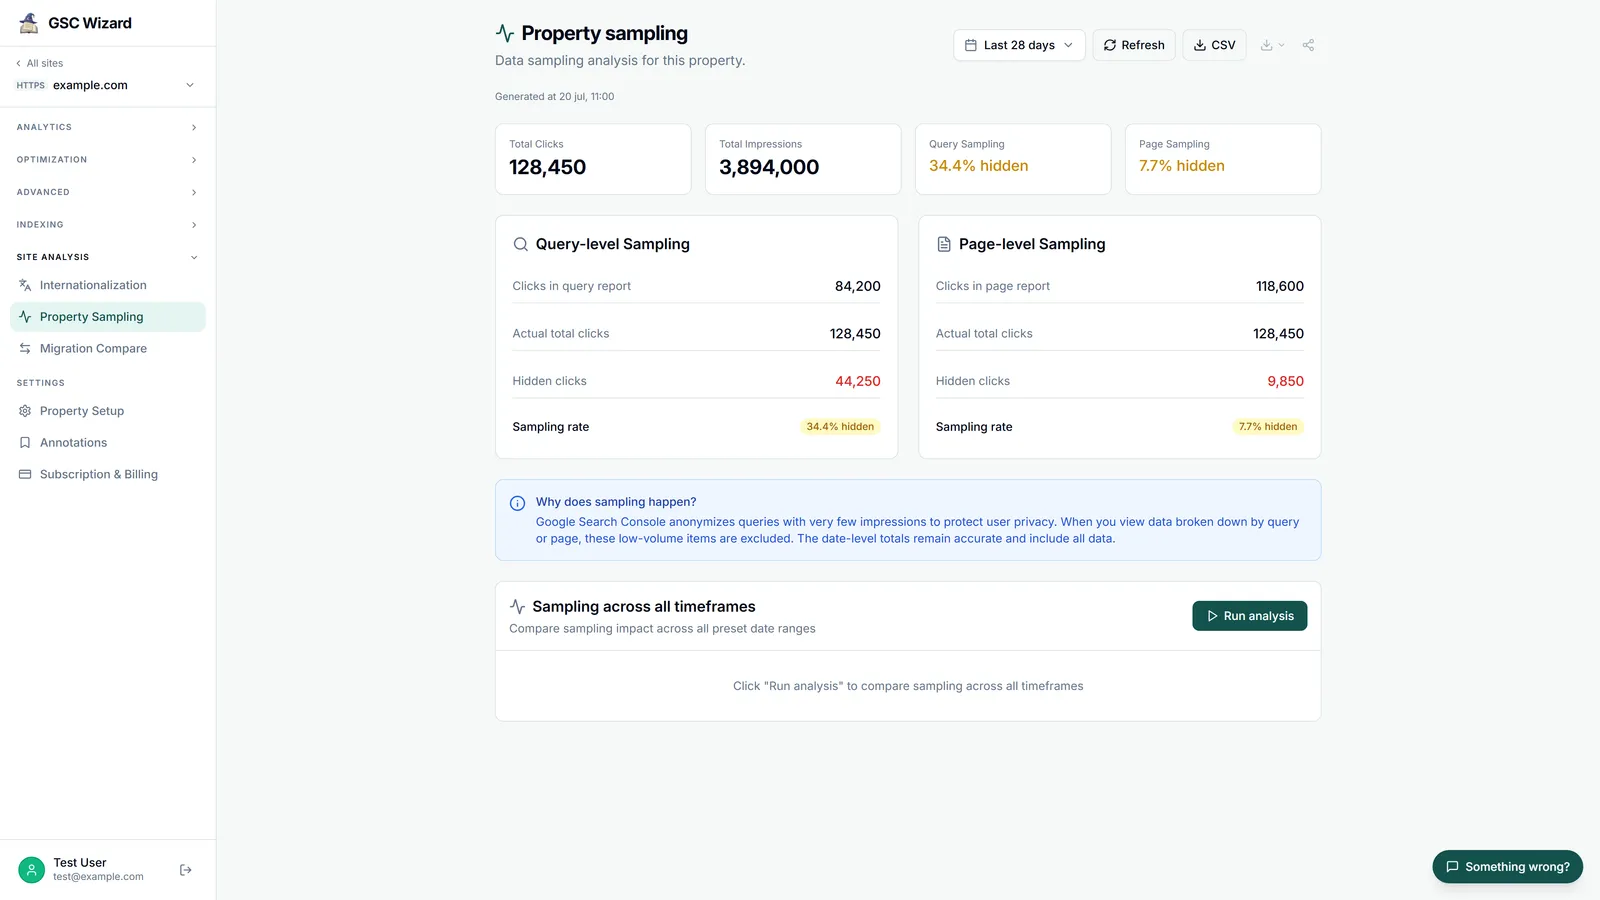
Because the data is stored, history keeps growing past Google's 16 months: after a year on full storage a property has about 28 months, and plans keep up to 10 years. Every table exports to CSV with all of its rows, or to a self-contained HTML report, as the exporting docs describe, and the export filename carries the date range. The Property Sampling report shows how many clicks Google leaves out of the query and page tables on your property, which is the part no tool can recover. Full storage is included in every plan (5 properties on Starter, 25 on Pro, 150 on Business), see pricing.
Where it stops: GSC Wizard does not show Google's Crawl Stats, because there is no API to read them from. It does show Bing's crawl data from the Bing Webmaster Tools API, with pages crawled, crawl errors and pages blocked by robots.txt on the Bing Overview and a Bing Crawl Issues report by URL, and it shows Google's last crawl time per URL through URL Inspection, within Google's 2,000-a-day quota. If you need every Googlebot request, a log file analyser is the better tool, and if you run a very large site with an engineer and a Cloud budget, setting up the BigQuery bulk export today is worth doing whatever else you use, because it can never fill in the days before you start it.
Frequently asked questions
How do I get more than 1,000 rows out of Google Search Console?
The 1,000-row cap belongs to the Search Console interface and its export button. To get more, use the Search Analytics API, which returns up to 25,000 rows per request and pages further with startRow, the Looker Studio connector, which reads the same API, or the bulk data export to BigQuery, which sends every row except anonymized queries but only from the day you set it up. Google documents an upper limit of about 50,000 rows per day per site per search type for the API and the Looker Studio connector; the bulk export is not affected by that limit.
How do I get more than 1,000 rows out of the crawl stats report?
You can't get a complete list out of the Crawl Stats report, because it has no API and Google describes its example URLs as a representative sample, not a full list. To collect more examples, export each slice of the report separately (every response code, file type, crawl purpose, Googlebot type and, on a domain property, each host) and repeat the exports over time, since Google weights the examples by day. For a complete record of what Googlebot requested, use your own server log files and verify Googlebot by reverse DNS. For single URLs, the URL Inspection API returns the last crawl time.
Is there an API for the Search Console Crawl Stats report?
No. The Search Console API offers four services: Search Analytics, Sitemaps, Sites and URL Inspection. Crawl Stats is not among them, so no tool can pull Google's crawl stats automatically. Bing Webmaster Tools does have crawl data in its API, through GetCrawlStats and GetCrawlIssues.
How many rows can the Search Console API return?
The rowLimit parameter accepts 1 to 25,000 rows per request and defaults to 1,000. You page through larger results with startRow until a response comes back with zero rows. Google states a maximum of about 50,000 rows of data per day per search type, sorted by clicks, so the tail of a very large site is cut off, and anonymized queries never appear.
Does the Search Console bulk data export to BigQuery include historical data?
No. The first export happens up to 48 hours after setup and includes data for the day of the export. Google's own advice for data from before the setup is to use the Search Console API or the reports, so the 16 months before that day have to come from the API.
Does the 1,000-row limit also apply to the Page indexing report?
Yes. Google says the example list of an indexing issue does not necessarily show all affected URLs and is limited to 1,000 rows. Filtering the report by a specific sitemap gives a different example list per sitemap, and the URL Inspection API checks individual URLs, within a quota of 2,000 inspections per day per site.
Does GSC Wizard show Google crawl stats?
No. Google offers no API for the Crawl Stats report, so GSC Wizard cannot import it. GSC Wizard does show Bing crawl data from the Bing Webmaster Tools API (pages crawled, crawl errors, pages blocked by robots.txt and a Crawl Issues report by URL), and last crawl times for individual Google URLs through URL Inspection.
Sources
- Google Search Central: A deep dive into Search Console performance data filtering and limits
- Search Console API: Search Analytics query and Getting your performance data
- Search Console API: Usage limits and API reference
- About bulk data export, Start a new bulk data export and the launch post
- Crawl Stats report and Page indexing report
- Verifying Googlebot and other Google crawlers
- Connect to Search Console (Looker Studio / Data Studio)
- Bing Webmaster API: GetCrawlStats