Yandex Webmaster
Connect Yandex Webmaster to see how the same site performs in Yandex, alongside your Google data. Useful if you get traffic from Russia, Turkey, Kazakhstan, Belarus or Uzbekistan.
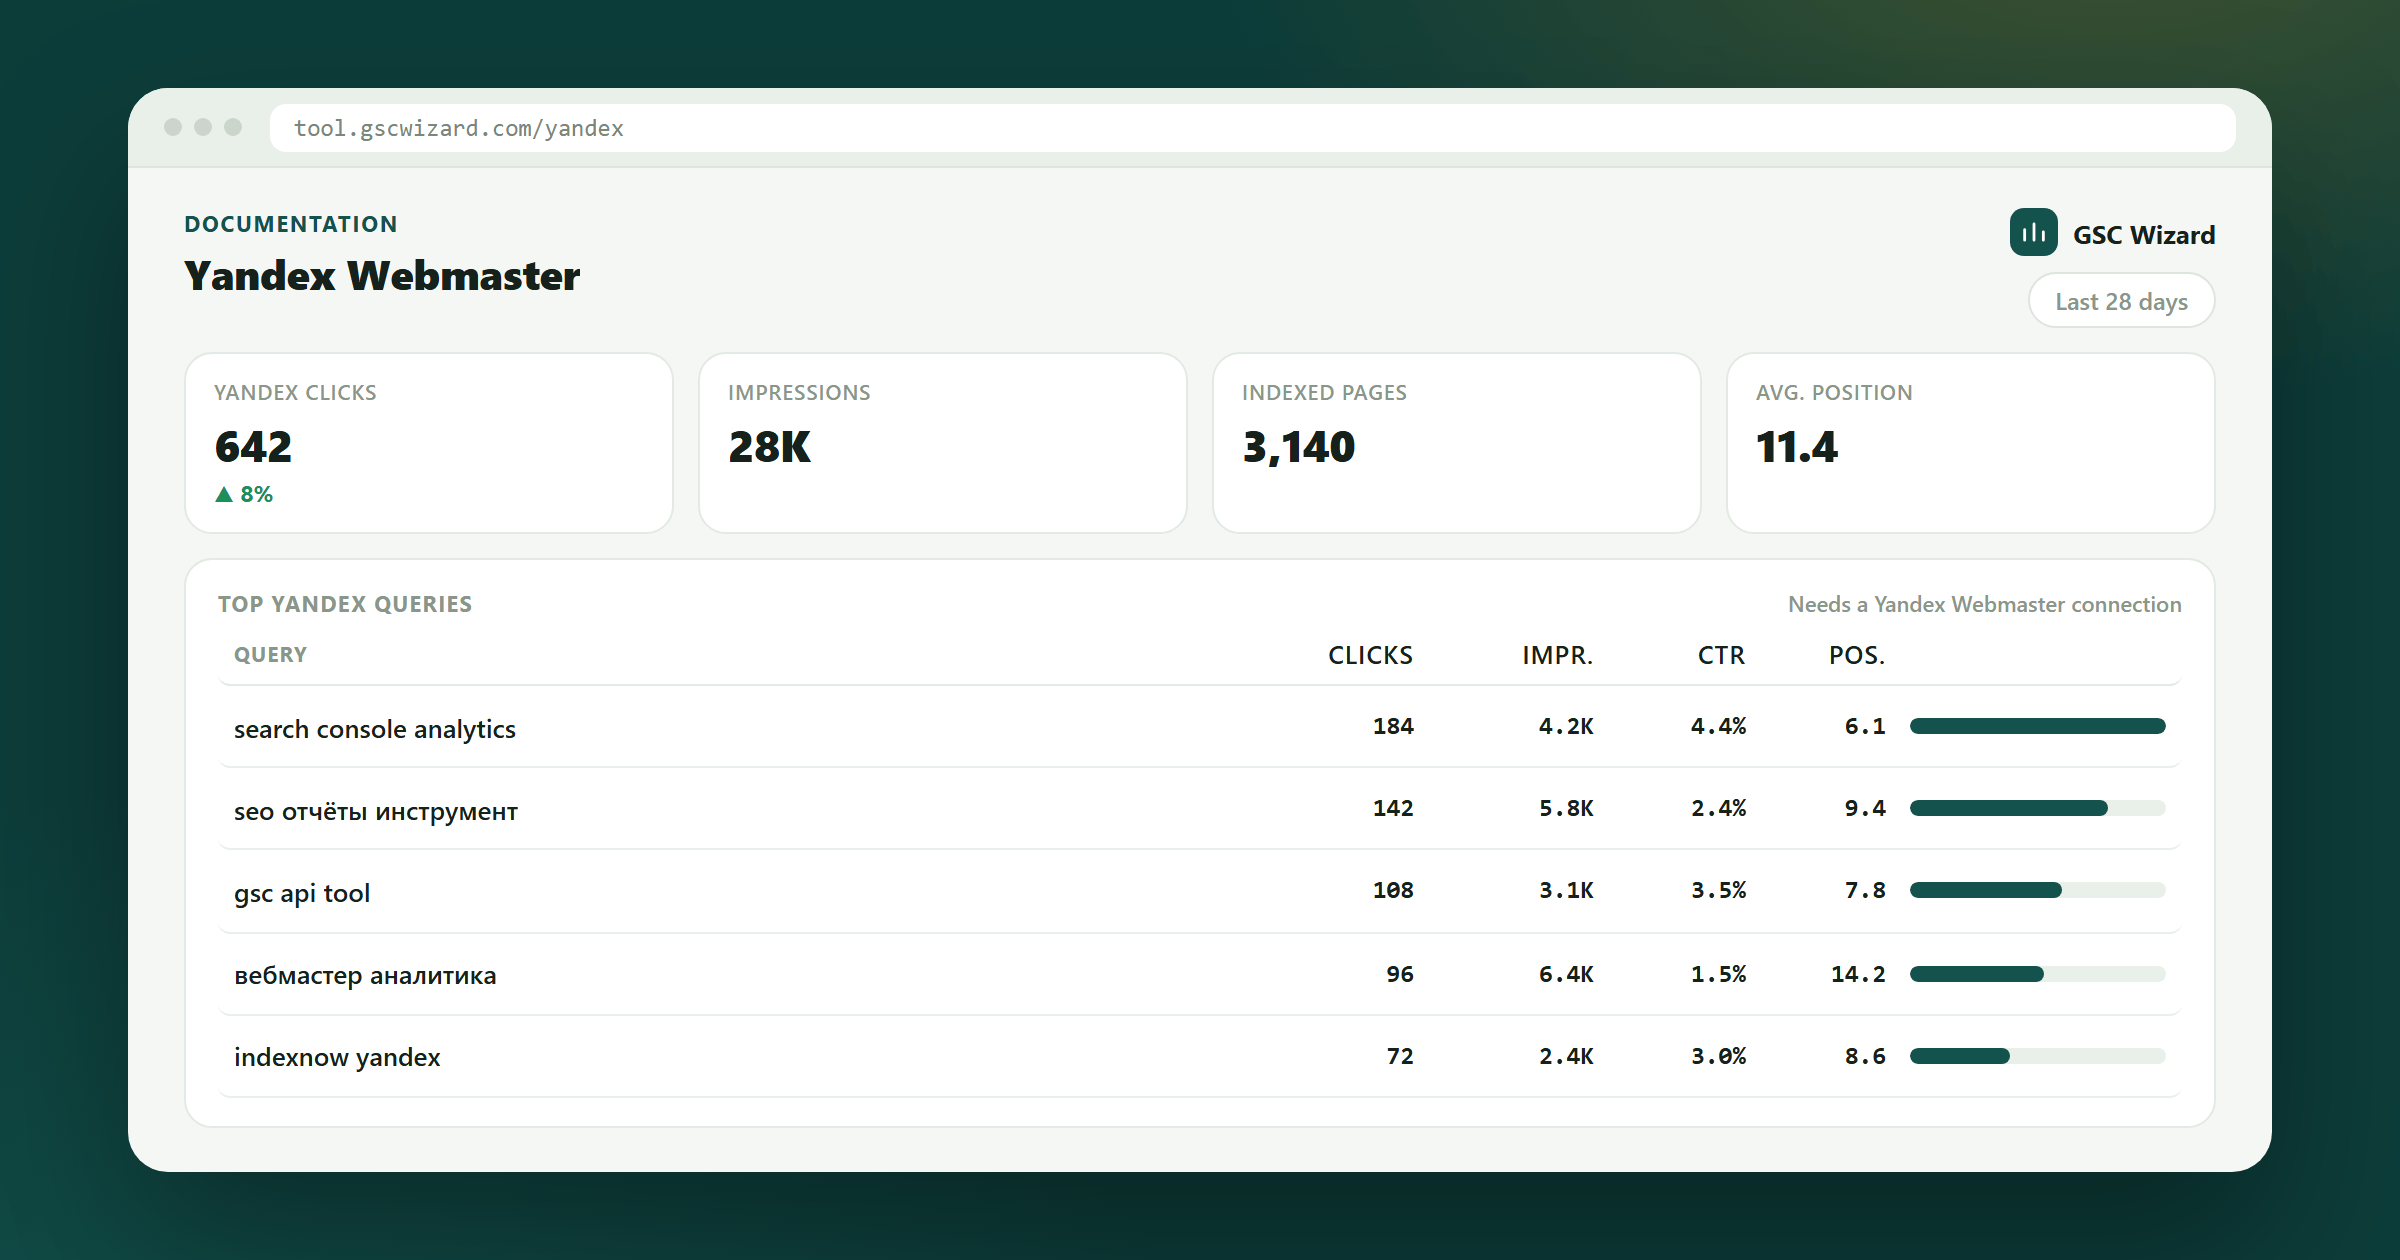
Connecting Yandex
Open Account settings and click Connect Yandex Webmaster. You will be sent to Yandex to approve the connection and returned here afterwards. Yandex publishes no read-only permission that returns data: the one that unlocks queries, indexing and site quality is the same one that covers adding and verifying sites, so the consent screen will say so. GSC Wizard only ever issues read calls with it and never adds, verifies or removes a site, and you can withdraw the permission at any time from your Yandex account.
Yandex only reports on sites that have already been added and verified in Yandex Webmaster itself. If a property is missing there, add and verify it first; Yandex may then need a few days before it has data to show.
One thing to know about Yandex sign-ins: unlike Google, a Yandex authorisation expires outright rather than renewing quietly in the background. GSC Wizard renews yours automatically each night, well ahead of expiry, so in normal use you will never notice. If a connection does lapse — for example after you change your Yandex password or revoke access — it cannot be renewed automatically and the reports will ask you to connect again.
When that happens, Account settings shows Reconnect needed with a Reconnect Yandex button, and the Yandex reports show the same prompt. The same prompt appears for a connection made before Yandex started requiring the webmaster:verify permission for its data endpoints: such a connection can still list your sites, but every report comes back empty until it is granted again. Reconnecting only re-grants the permission; nothing else changes, and GSC Wizard still only reads.
Yandex data is read with the property owner’s Yandex connection and is not yet shared with people a property is shared with: they see a note saying so in place of the reports. Disconnecting revokes the authorisation at Yandex as well as removing it here.
Requires Yandex connectionYandex reports
Three reports sit under a property’s Yandex Overview entry in the sidebar. The Overview and Indexing reports load on arrival. The Queries report waits for you to press Run analysis, because it walks Yandex’s whole query pool in pages of 500; change the device filter afterwards and it asks before running again.
Yandex Overview
Site quality index, pages in search, excluded pages, an impressions and clicks trend, and the problems Yandex is currently reporting.
Yandex Queries
The queries Yandex reports, with impressions, clicks, CTR and both position metrics, filterable by device.
Yandex Indexing
Crawl responses by day, how many pages are in Yandex search, which pages entered or left the results, and broken internal links.
The appeared-in-search and removed-from-search series on the Indexing report is worth knowing about: Google Search Console has no equivalent, so it is the one place you can watch pages entering and leaving an index day by day.
What Yandex does not report
Yandex publishes considerably less than Google does, and the gaps change how you should read these numbers. None of these are things GSC Wizard can work around — the data is not in Yandex’s API at all.
- Query totals are a floor, not a total. Yandex returns only its top queries for the period you ask for, at most 3,000 of them. GSC Wizard fetches all of them (Yandex serves 500 at a time, so the report pages through the pool), but the long tail below that cut-off is absent from Yandex’s API, so real traffic is higher than the sum of the rows you see. Treat the totals as a lower bound and do not reconcile them against Google’s. This cap applies to the query table only: the impressions and clicks chart on the Overview is Yandex’s own site-level daily total and is not capped.
- Yandex finishes a day later than Google does. Its last complete day runs about four days behind, against two or three in Search Console, so the end of the range is pulled back to the last day Yandex has finished and the report shows the range it actually served.
- No queries by page. Yandex has no report joining queries to URLs, so there is no Yandex equivalent of cannibalisation, page poaching, or a per-page query list.
- No CTR metric. Yandex reports impressions and clicks but no click-through rate, so the CTR column is calculated from the two.
- No country breakdown, and device is a filter rather than a column — each device choice is a separate request to Yandex.
- No period-over-period comparison. Yandex returns no previous-period series, so the Yandex reports show a single window and the comparison control is not offered on them.
- Positions are not comparable with Google’s. Yandex measures position differently and splits it in two: average position when shown, and average position of results that were clicked. Never average a Yandex position together with a Google one.
- Yandex tracks whole hosts, not URL prefixes. A property with a path (such as
https://example.com/blog/) is matched to its host, so its Yandex figures cover the entire host rather than only the pages under that path. The reports say so when it applies. - Yandex caps requests per account per day. When the cap is hit the reports show the time Yandex says it resets, and nothing is re-requested until then.
Yandex in the MCP server
The same data is available to AI assistants through the GSC Wizard MCP server, using the Yandex connection on your account — there is nothing extra to set up. The Yandex Webmaster MCP page shows what you can ask it.
list_yandex_sites— the sites in your Yandex account, with verification status.get_yandex_site_summary— quality index, pages in search, excluded pages and open problems.get_yandex_query_stats— queries with impressions, clicks, CTR (a percentage, 0 to 100) and positions.get_yandex_indexing_history— crawl responses, pages in search, and search appearance changes.