Dashboard & properties
The home screen lists every property you track; opening one gives you the full performance dashboard.
My Sites
The landing page is a grid of your connected properties. Each card shows clicks, impressions, CTR, and average position for the selected period, with change indicators against the comparison period. Click any card to open that property.
The grid is pre-warmed on load so the first batch of numbers appears quickly. A cross-site summary at the top totals traffic across everything you track.
The property dashboard
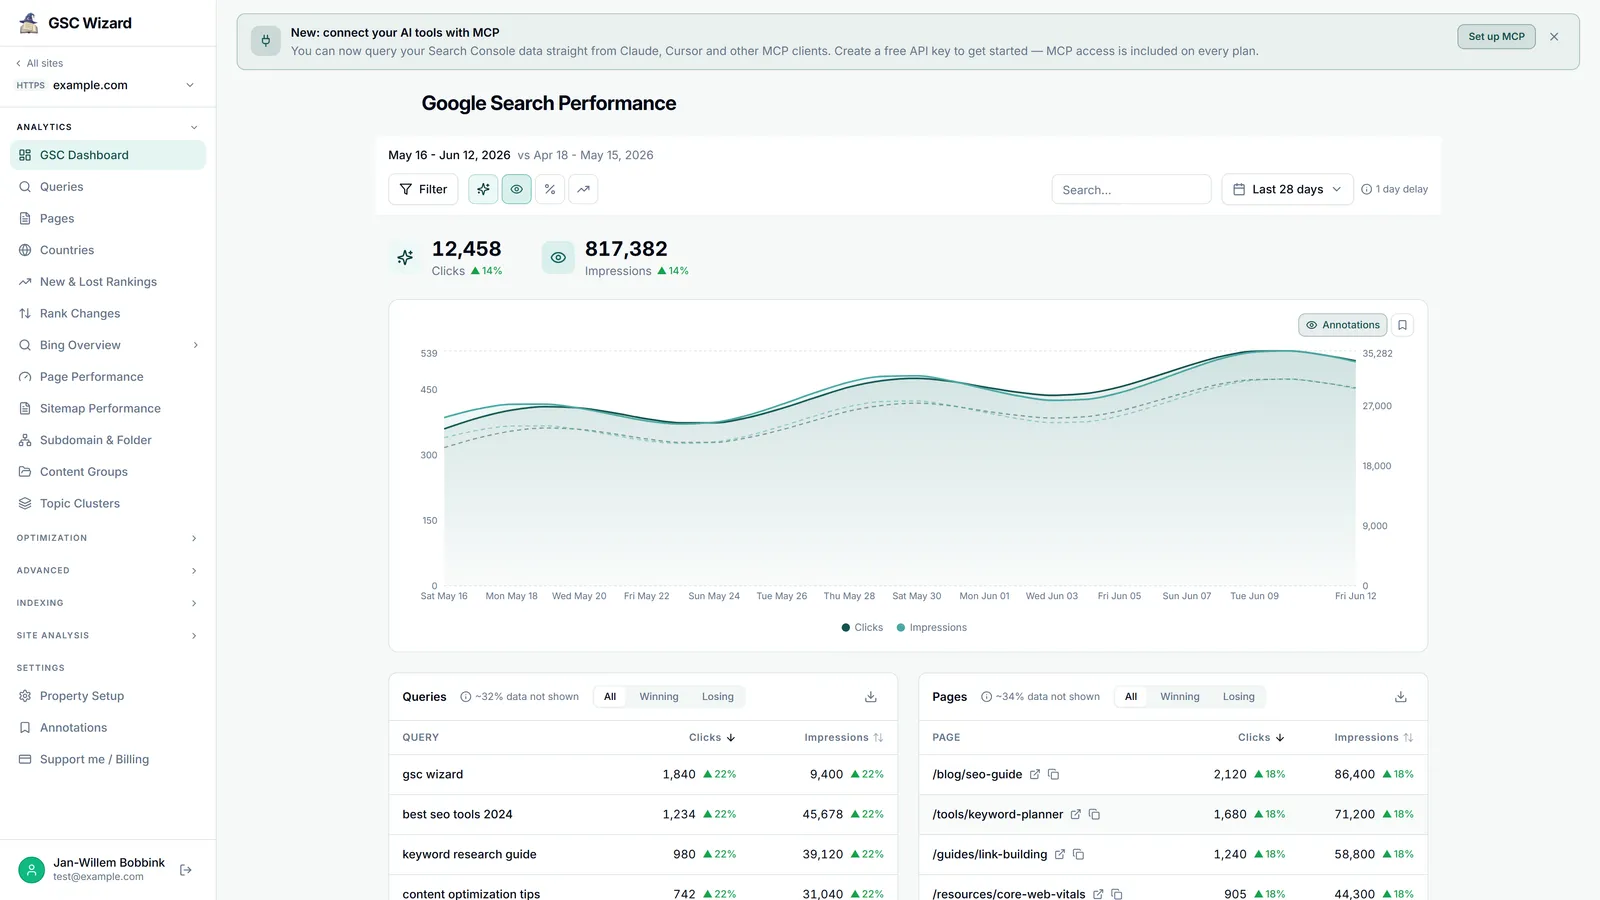
Opening a property gives you the main overview, assembled from the Search Console performance report.
Summary metrics
Clicks, impressions, CTR, and average position for the period, each with the change versus your comparison period.
Main trend chart
A time-series of the metric you choose (clicks, impressions, CTR, or position) with day, week, or month grouping. Annotations overlay important dates, and you can export the chart to PNG.
Top tables
Top Queries, Top Pages, Countries, and Devices, each sortable with per-table copy and CSV export. Tables load a fast preview and fetch the complete, uncapped dataset the moment you sort, switch tabs, or export.
Deeper cards
Below the fold: branded vs non-branded analytics, query counting, impressions by position, new rankings, and page ranking. These load progressively so the page stays responsive.
Everything on the dashboard responds to the active filters, date range, and comparison period, plus any topic-cluster or content-group scope you apply.
Drilling in
Click a query or page row to reload the dashboard filtered to it. Use the left sidebar to jump into any of the detailed reports covered in the rest of these docs. For an overview of a single metric across all sites, the top-level Global Reports page aggregates one view across every property at once.