Advanced analysis
Change Point Detection
Find the dates where your traffic shifted to a new level.
Run analysis
The series is smoothed, then a sliding window compares the average before and after each day, flagging a change point when the standardised difference exceeds your sensitivity. Needs at least 14 days.
What you get
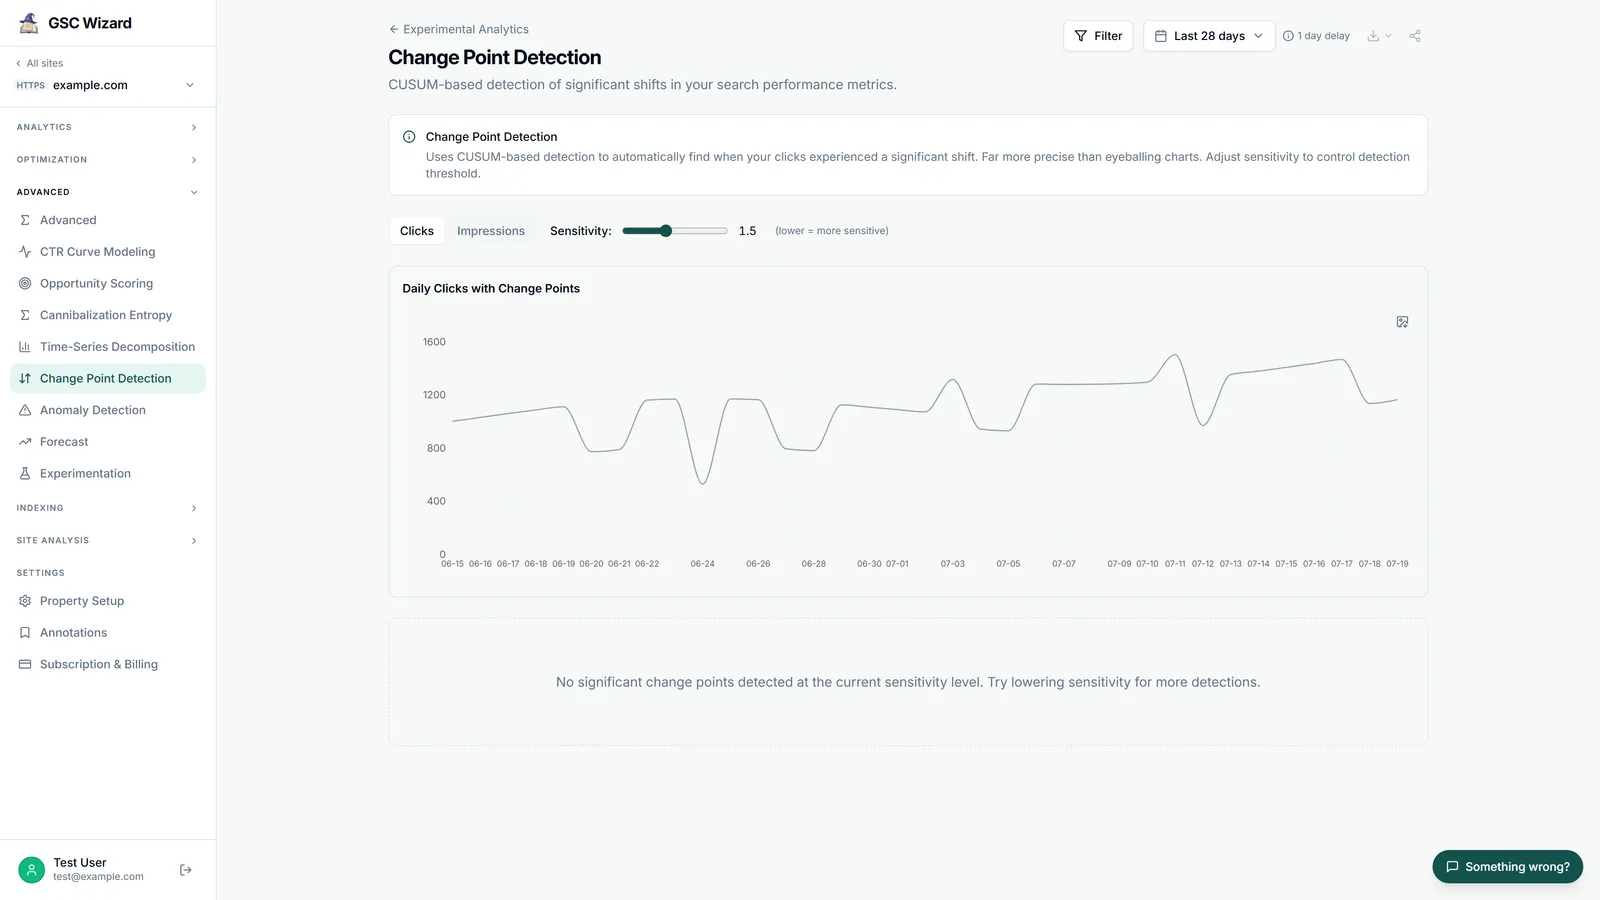
- A sensitivity slider (0.5–3, default 1.5; lower is more sensitive).
- A line chart with dashed reference lines and the % change at each change point.
- A table of before/after averages, direction, and change %, plus export.
Part of Advanced analysis. Related: Time-Series Decomposition, Anomaly Detection.