Advanced analysis
Time-Series Decomposition
Separate daily traffic into an underlying trend, a weekly seasonal pattern, and leftover noise.
Run analysis
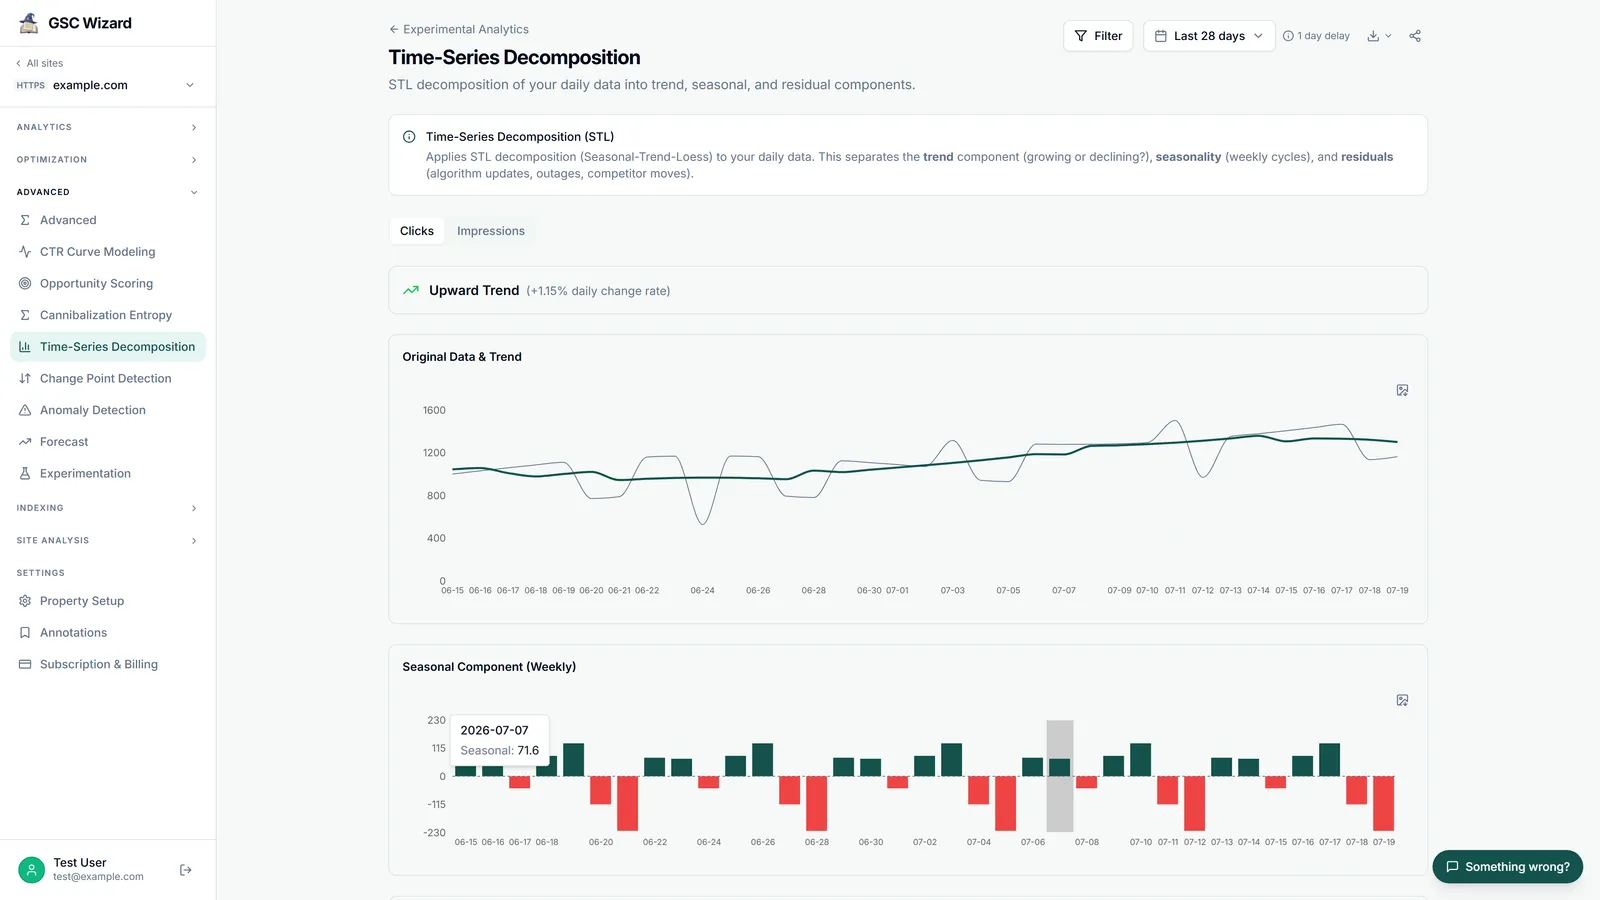
Choose clicks or impressions (at least 14 days of data), and the tool splits the series into trend, a 7-day seasonal component, and the residual, summarising the trend direction as growing, declining, or stable with a daily % change.
What you get
- An original-plus-trend line chart and a weekly seasonal bar chart.
- A residual scatter plot that highlights points beyond ±2 standard deviations as possible one-off events (algorithm updates, outages, competitor moves).
- Export.
Part of Advanced analysis. Related: Change Point Detection, Anomaly Detection.