Organic Shopping
Free listing performance from Google Merchant Center, with the products Google believes would earn traffic and currently cannot.
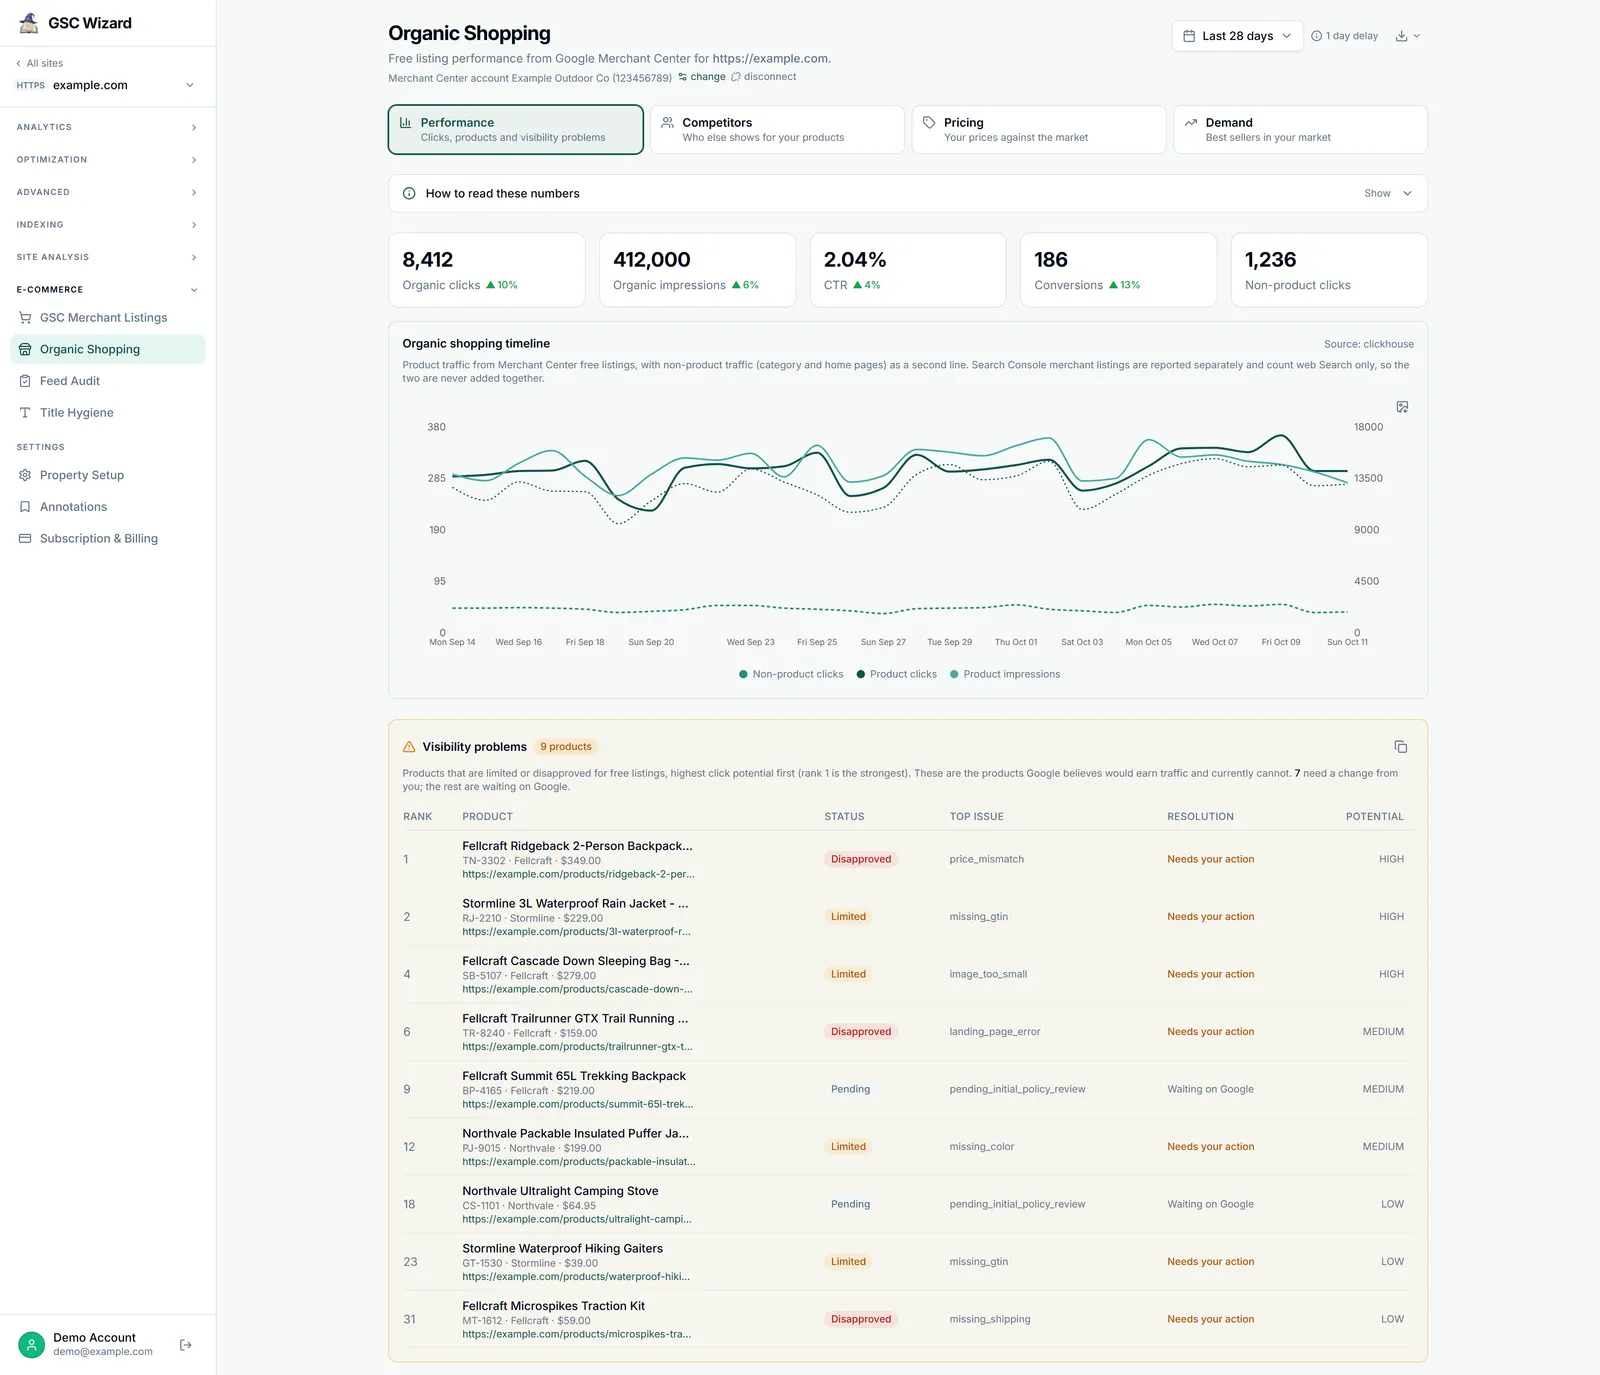
Organic Shopping is also where a property is linked to its Merchant Center account: before that, it shows a connect card or the account picker (see Connecting Merchant Center). Once linked, the report loads as soon as you open it, and each section fills in from its own request.
What you get
A row of four cards at the top switches between the reports. A tab only loads its data when you open it.
Performance
Clicks, products and visibility problems. Five tiles (Organic clicks, Organic impressions, CTR, Conversions and Non-product clicks), the Organic shopping timeline with non-product traffic (category and home pages) as a second line, Visibility problems, a chart of your top products by organic clicks, and the Product performance table with each offer’s free listing status, click potential and top issue.
Competitors
Competitive visibility per country and Google product category, in three views: Competitors, Top merchants and Benchmark. Columns are Relative visibility (how often a domain was shown compared to you), Ads / organic, Page overlap and Higher position.
Pricing
Price competitiveness: your price beside Google’s benchmark for the same product (the typical price other merchants charge, matched on GTIN) and, where Merchant Center has one, the suggested sale price with the change in impressions and clicks Google predicts for it.
Demand
Best sellers: the most demanded product clusters or brands in your market according to Google, ranked, with whether you stock them. Clusters you do not stock at all are highlighted as demand you are not competing for.
Visibility problems
The section most worth your time, so it sits high on the Performance tab.
- Products that are limited or disapproved for free listings, highest click potential first (rank 1 is the strongest).
- Each row shows the status (Limited, Disapproved or Pending), the top issue, and the resolution: Needs your action or Waiting on Google.
- The list loads 100 at a time with Show 100 more, up to 1,000 products. Fixing these moves the next ones up.
How to use it
- Open a property, expand E-COMMERCE in the left sidebar, and click Organic Shopping.
- Pick a date range, and a comparison period if you want change badges.
- Start with Visibility problems: work through the rows marked Needs your action, highest rank first.
- Open How to read these numbers above the tiles before you compare these figures with anything else.
- Open Competitors, Pricing or Demand when you want the market view.
Controls
- Date range and comparison period.
- Group the product chart and table by Offer, Brand, Category, Product type or Country.
- Competitors: Country and Category pickers and the view switch. Pricing: sort by Opportunity or Price gap. Demand: Country, Weekly or Monthly, and Product clusters or Brands.
- Copy buttons on the tables, and an export menu with Timeline CSV, Product table CSV and Visibility problems CSV on Performance, and one CSV per market tab.
- change and disconnect in the header, for the linked account.
Data source and freshness
- Merchant Center data through the Merchant API. Linking an account queues 180 days of performance history, 28 days of competitive visibility, and snapshots of product status, product links and prices.
- Until the warehouse holds the property’s data, the reports read live from the Merchant API: the timeline shows Source: merchant-api, and the market tabs say Merchant API (live). Once synced, the timeline shows Source: clickhouse.
- A nightly run re-fetches the last four days and refreshes the snapshots, for properties whose owner has an active subscription or trial. Best sellers are fetched weekly, and Google publishes them with up to two weeks of lag, so the report date shown is the latest available, not the current week.
- Dates are in the merchant’s reporting time zone, not UTC, and Merchant Center can correct performance data up to 3 days back, so the most recent days still move.
Limits
- Merchant Center free listing numbers and Search Console merchant listings count different things and are never added together. See GSC Merchant Listings.
- On 24 August 2026 YouTube affiliate traffic moved out of organic into its own value, restated back to 1 July 2026. A step in the lines around those dates is a definition change, not lost traffic, and the timeline flags it.
- Merchant Center omits rows where every metric is zero. Conversions need a Merchant Center conversion source.
- The market tabs depend on Google’s own eligibility: price benchmarks need products with valid GTINs, price suggestions need purchase conversions reported to Merchant Center, and competitive visibility and best sellers need enough traffic, a threshold Google does not publish.
- Google licenses pricing benchmarks and suggestions and best-seller rankings for the retailer’s internal use only: they are excluded from shared reports and the client portal, and cannot be resold or published.
- The Merchant API quota belongs to your Merchant Center account. The daily quota resets at midnight Pacific time.
Part of Google Merchant Center. Related: Connecting Merchant Center, Feed Audit, Title Hygiene.