Optimization
CTR Benchmark
Find the queries whose click-through rate is unusually high or low for where they rank.
Run analysis
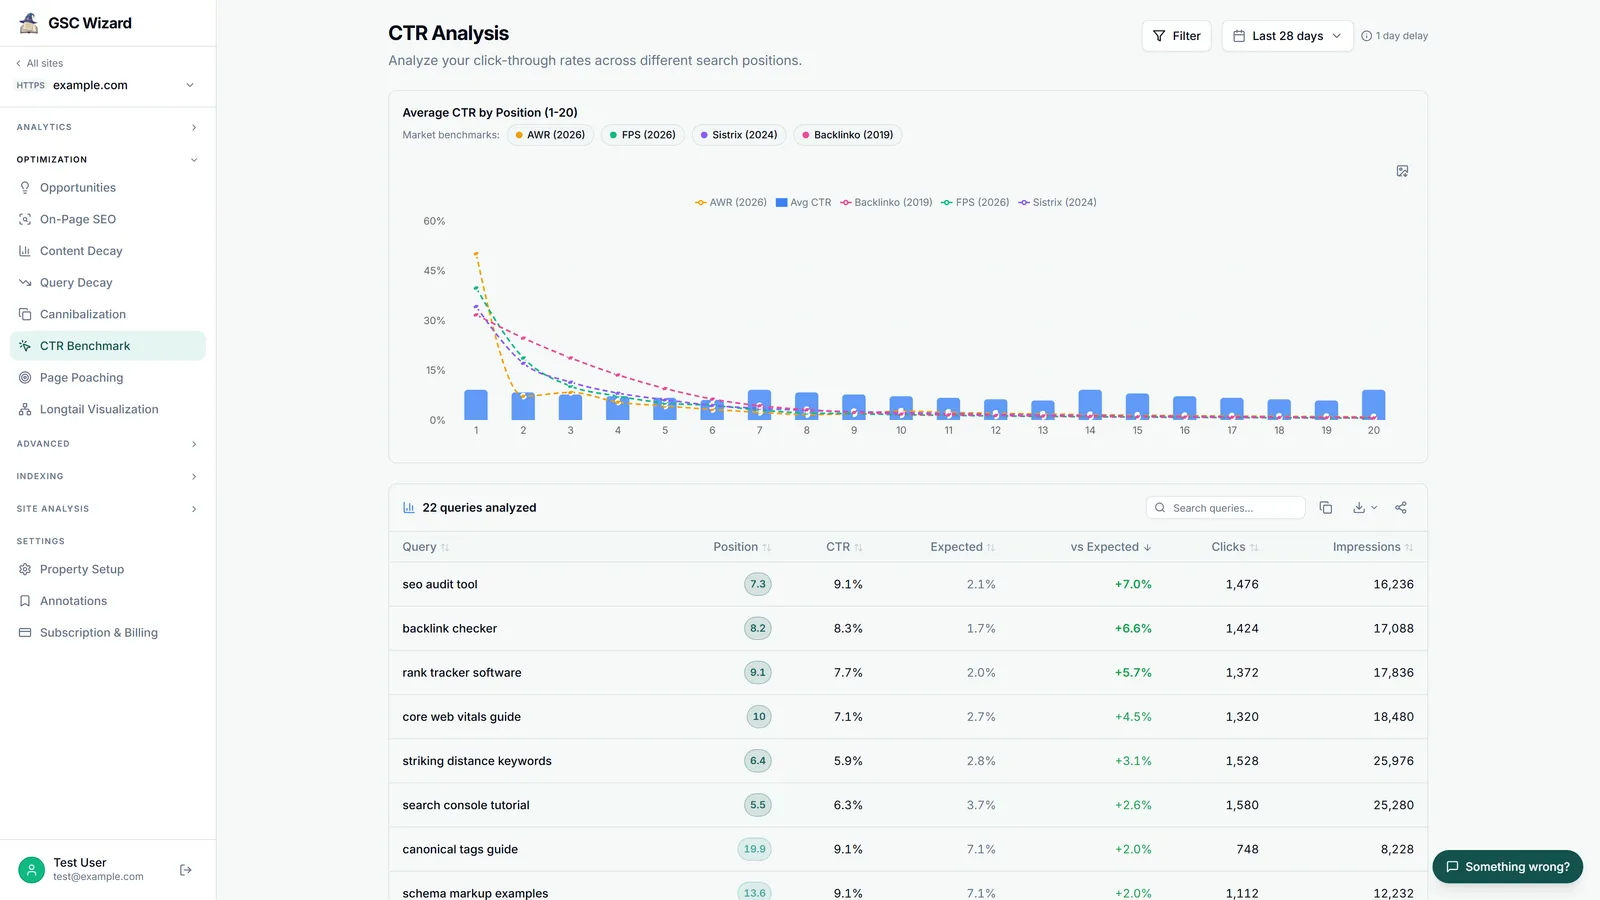
After you run it, the report builds a CTR curve from your own queries, then computes an expected CTR and gap for every query with at least 10 impressions ranking in the top 20.
What you get
- A sortable, searchable, paginated table (query, position, CTR, expected, vs expected, clicks, impressions) with over- and under-performers colour-coded.
- A bar chart of average CTR by position 1–20, optionally overlaid with your overall-site line and market-benchmark curves from published studies.
- The shared filter panel with saved filters and branded handling, and a comparison period.
- CSV and HTML export, plus chart PNG export.
A large negative gap usually means the title or meta description is worth rewriting. See also Page Poaching and the advanced CTR Curve Modeling.
Part of Opportunities & quick wins. Related: Page Poaching.