Health, recovery and risk
How the Migration health banner turns two windows into one verdict, and how the risk score, recommendations and checklist decide what to fix first.
Everything on this page needs a go-live date and at least one post-launch day with final data. Without a go-live date, the banner explains that both sides were compared over one range instead.
Recovery
The new side’s clicks per day over the after window, as a percentage of the old side’s clicks per day over the before window.
- Per day, so windows of different lengths stay comparable. 100% means the new setup gets as many clicks a day as the old one did.
- With fewer than 10 clicks in the before window there is no recovery figure, and the banner reads Insufficient data. Before the first post-launch day has final data, it reads No post-launch data yet instead.
- The banner caps the figure at 120% (shown as 120%+) so a small baseline cannot dominate; the uncapped value is in its tooltip.
- With the same weeks last year as baseline, recovery is measured against last year’s weeks instead.
- The charts also show a 7-day recovery for each day: the trailing 7 days of the new side against the baseline’s clicks per day. The projection is fitted to those points.
Stages and pace
Recovery is judged against where a migration on track usually stands at the same stage. These expectations are rules of thumb, not a guarantee for any one site.
| Stage | Expected recovery by the end of it |
|---|---|
| Days 1-14 | 25% |
| Days 15-30 | 40% |
| Days 31-56 | 60% |
| Days 57-90 | 70% |
| Days 91-180 | 90% |
| Day 181 on | 100% |
- The stage is the one at the end of the after window. A From go-live window over days 1-28 is judged as day 28, even when you open it on day 200.
- A window that starts at go-live (From go-live, Full period) averages the whole climb, dip included, so beyond the first stage it is judged against what a migration on track averages over the same days.
- Pace is recovery divided by the expected level: Ahead of pace at 1.1 or more, On track at 0.85 or more, Behind pace at 0.6 or more, and Far behind below that. It reads Too early to judge in the first three days, and Pace not judged without a recovery figure.
Momentum
The new side’s clicks over the last 7 days against the 7 days before: above +5% is Accelerating, below -5% is Slowing, anything between is Steady. It needs 14 days after go-live.
Projected recovery
The Recovery curve card fits a curve to the observed 7-day recovery and projects it forward, with a likely range and the dates each recovery level is expected.
- The fit starts on day 7, because earlier points average fewer than 7 days and their weekday mix is uneven. It needs at least 10 observations.
- The main model is a plateau: recovery climbs from where it started towards the level it settles at, ever more slowly. It is fitted the same way every time, so the same data always gives the same curve. When a plateau explains the data poorly, a logarithmic or a straight-line curve is used instead, and when nothing fits there is no projection yet.
- The Likely range band runs from the 10th to the 90th percentile of 200 refits on resampled data, resampled in 7-day blocks so the weekly pattern stays together.
- The milestones are 25, 50, 75, 90 and 100%. A milestone counts as Reached once the observed 7-day recovery has held at or above it for 7 days in a row, so one good week does not mark it. Otherwise it shows the projected date with its range, or Not on current trend when the curve levels off below it.
- Confidence is High with 42 or more observations, an R² of at least 0.7 and a band narrower than 25 points at the last observed day, Medium with 21 or more observations and an R² of at least 0.4, and Low otherwise.
URL success by migration unit
With a redirect map, the mapped URLs are grouped into migration units: old and new URLs linked by the map, judged together.
- A unit is one to one, a consolidation (several old pages into one new page), a split (one old page into several new pages) or many to many.
- A unit’s before clicks are its old URLs’ clicks over the before window; its after clicks are its new URLs’ clicks over the after window. Five old pages merged into one new page are one result, not one win and four losses.
- A unit counts as recovered at 50% or more of its baseline clicks, partial at 10% or more, and failed below that. A unit with fewer than 5 baseline clicks is not judged.
- URL success is the share of judged units that recovered.
- In the Pages table, a target’s after clicks are split over the old URLs that point at it, in proportion to the clicks each carried before, so a consolidated target is never counted twice.
Risk score
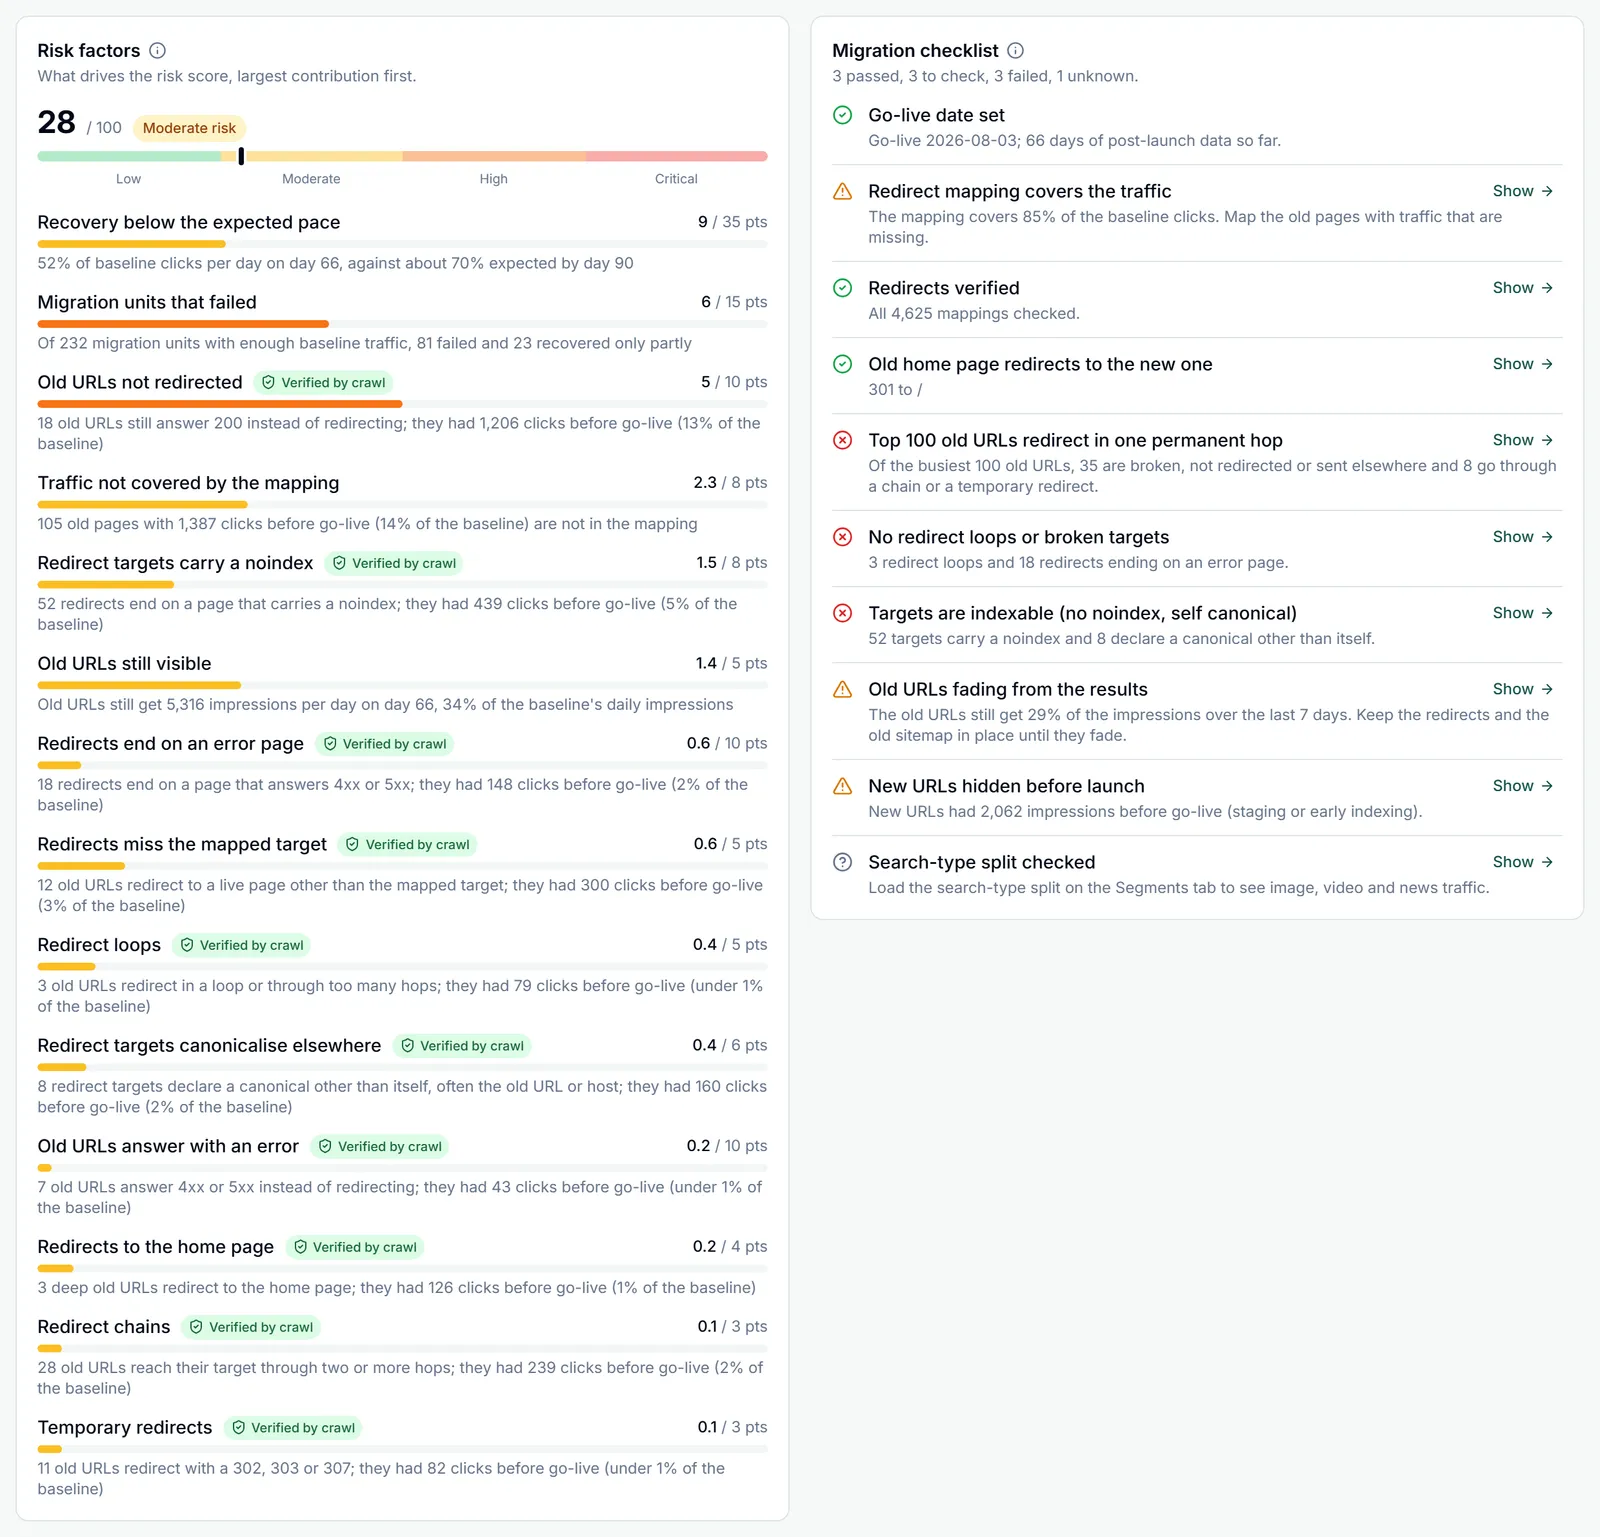
A score from 0 to 100: capped factors added up, then capped at 100. Under 25 is Low risk, under 50 Moderate risk, under 75 High risk, and 75 or more Critical risk. The Risk factors card on the Overview tab lists what drives it, largest first.
| Factor | Max points | How it scales |
|---|---|---|
| Recovery below the expected pace | 35 | With the shortfall against the expected recovery for the stage. |
| Migration units that failed | 15 | Failed units in full and partial units at half, as a share of judged units. Needs at least 5 judged units. |
| Recovery is slowing | 10 | Only when momentum is Slowing and recovery is under 90%. Full points at a 30% drop week over week. |
| Old URLs answer with an error | 10 | Verified. Full points when the affected old URLs carried 25% of the baseline clicks. |
| Old URLs not redirected | 10 | Verified. Full points at 25% of the baseline clicks. |
| Redirects end on an error page | 10 | Verified. Full points at 25% of the baseline clicks. |
| Redirect targets carry a noindex | 8 | Verified. Full points at 25% of the baseline clicks. |
| Traffic not covered by the mapping | 8 | Full points when unmapped old pages carried 50% of the baseline clicks. |
| Redirect targets canonicalise elsewhere | 6 | Verified. Full points at 25% of the baseline clicks. |
| Redirect loops | 5 | Verified. Full points at 10% of the baseline clicks. |
| Redirects miss the mapped target | 5 | Verified. Full points at 25% of the baseline clicks. |
| Old URLs still visible | 5 | After day 30, once old URLs still get more than 20% of the baseline’s daily impressions. Full points at 70%. |
| Redirects to the home page | 4 | Verified. Full points at 25% of the baseline clicks. |
| Redirect chains | 3 | Verified. Full points at 50% of the baseline clicks. |
| Temporary redirects | 3 | Verified. Full points at 50% of the baseline clicks. |
Verified factors rest on redirect checks, from GSC Wizard’s own crawler or a Screaming Frog import, and grow with the share of baseline clicks the affected URLs carried. Until the redirects are verified they do not count, and the card says so: a low score with nothing verified only means nothing has been checked yet.
Health status
The banner’s status, with a one-sentence headline such as At risk: 52% of baseline clicks per day on day 66, behind the 70% expected by day 90.
- Insufficient data: no recovery figure yet.
- Critical: pace is Far behind, or the risk score is 75 or more.
- At risk: pace is Behind, or the risk score is 50 or more.
- Healthy: recovery is 90% or more and the risk score is under 25.
- Recovering: anything else.
Recommendations
Up to 12, ordered by severity (critical, high, medium, low) and then by the baseline clicks at stake. Each appears only when the report holds the evidence for it, and clicking one opens the tab and rows behind it.
- One per redirect problem the checks found, with the count and the clicks at stake. Broken old URLs, old URLs not redirected, broken targets, loops and noindexed targets are critical once they carry 5% of the baseline clicks.
- Verify your redirects when there is a map but nothing is checked yet, and Upload a redirect mapping when there is none.
- Old pages with traffic that are missing from the map, once they carry 5% of the baseline clicks.
- Old URLs that still collect more than 20% of the baseline’s daily impressions after day 14: make sure every old URL answers with a 301, keep the old sitemap submitted for a while so search engines recrawl it, and, when the domain changed, file the move with the Change of Address tool.
- New URLs that were visible before go-live, usually a staging host or an early launch.
- Recovery behind pace.
- Up to two query topics and two URL sections with at least 5% of the baseline that recovered under 50%.
- Countries or devices with at least 10% of the baseline that recover 25 points or more below the rest.
Migration checklist
The Migration checklist card on the Overview tab reads the same report as a launch list. Each item is Pass, Check, Fail or Unknown; it reads Unknown when the check it needs has not run, so nothing passes on a guess.
- Go-live date set.
- Redirect mapping uploaded, a Check while there is no map. Once there is one, the item becomes Redirect mapping covers the traffic: it passes when mapped old URLs carry 90% of the baseline clicks and fails under 50%.
- Redirects verified.
- Old home page redirects to the new one.
- Top 100 old URLs redirect in one permanent hop, by clicks before go-live. A broken, missing, wrong or looping redirect fails it; a chain or a temporary redirect is a Check.
- No redirect loops or broken targets.
- Targets are indexable (no noindex, self canonical): a noindex fails, a canonical pointing elsewhere is a Check.
- Old URLs fading from the results: passes once the new URLs carry 90% of the impressions over the last 7 days, fails when they still carry under half after day 30.
- New URLs hidden before launch.
- Search-type split checked: Unknown until the split on the Segments tab is loaded; a Check when image search had 10% or more of the baseline and recovered under 50%.
- Alerts on, for a saved migration.
Part of Migration analysis. Related: Redirect maps and verification, Reading the results.