Reading the results
Seven tabs, each answering one question about the move. Badges on the tab names count lost pages, lost queries and redirect problems.
Above the tabs
- Analysis warnings lists anything that limits the data, such as a shortened window, missing days or a read that hit its row limit. See the warnings table in Windows and baselines.
- The header names side A and side B, shows the dates of both windows and the Latest complete day, and holds Refresh (fetch everything again, bypassing the cache) and the Export menu.
- In Property vs property mode a Data source switch picks Google or Bing. See Bing data.
- Side A is drawn in teal and side B in amber. Charts export as PNG, and tables can be copied.
Overview: the verdict
Is the migration on track, and what should be fixed first?
- Migration health: status, headline, recovery, pace, momentum, risk score, days since go-live, the projected date of 90% recovery and URL success. See Health, recovery and risk.
- Key figures: clicks per day, impressions per day, CTR, average position (impression-weighted, so a negative change is an improvement), total clicks, active pages (pages with at least one impression), Mapping coverage (the share of baseline clicks on mapped old URLs), Old URLs still in search, the New URLs’ share of impressions over the last 7 days, and New URLs before launch.
- Daily traffic: side A and side B per day, with the before and after windows shaded, the go-live marker and your annotations of both properties, plus the 7-day recovery under it. A migration shows A falling away and B taking over around go-live.
- Recovery curve and Recommendations side by side.
- Before vs after, day by day: day 1 of the before window next to day 1 of the after window, so both sit on one axis whatever their dates. The note under it says whether both windows start on the same weekday; when they do not, the 7-day average smooths out the weekly peaks.
- Risk factors and the Migration checklist.
- Why clicks changed: the click change split into three effects. Demand is the change in impressions at the old CTR. Position is what the move in ranking alone predicts, using a CTR-by-position curve built from your own queries before go-live. CTR is what is left at the same position: titles, snippets and SERP features. Rest is what the split could not assign.
Pages: which URLs lost and gained
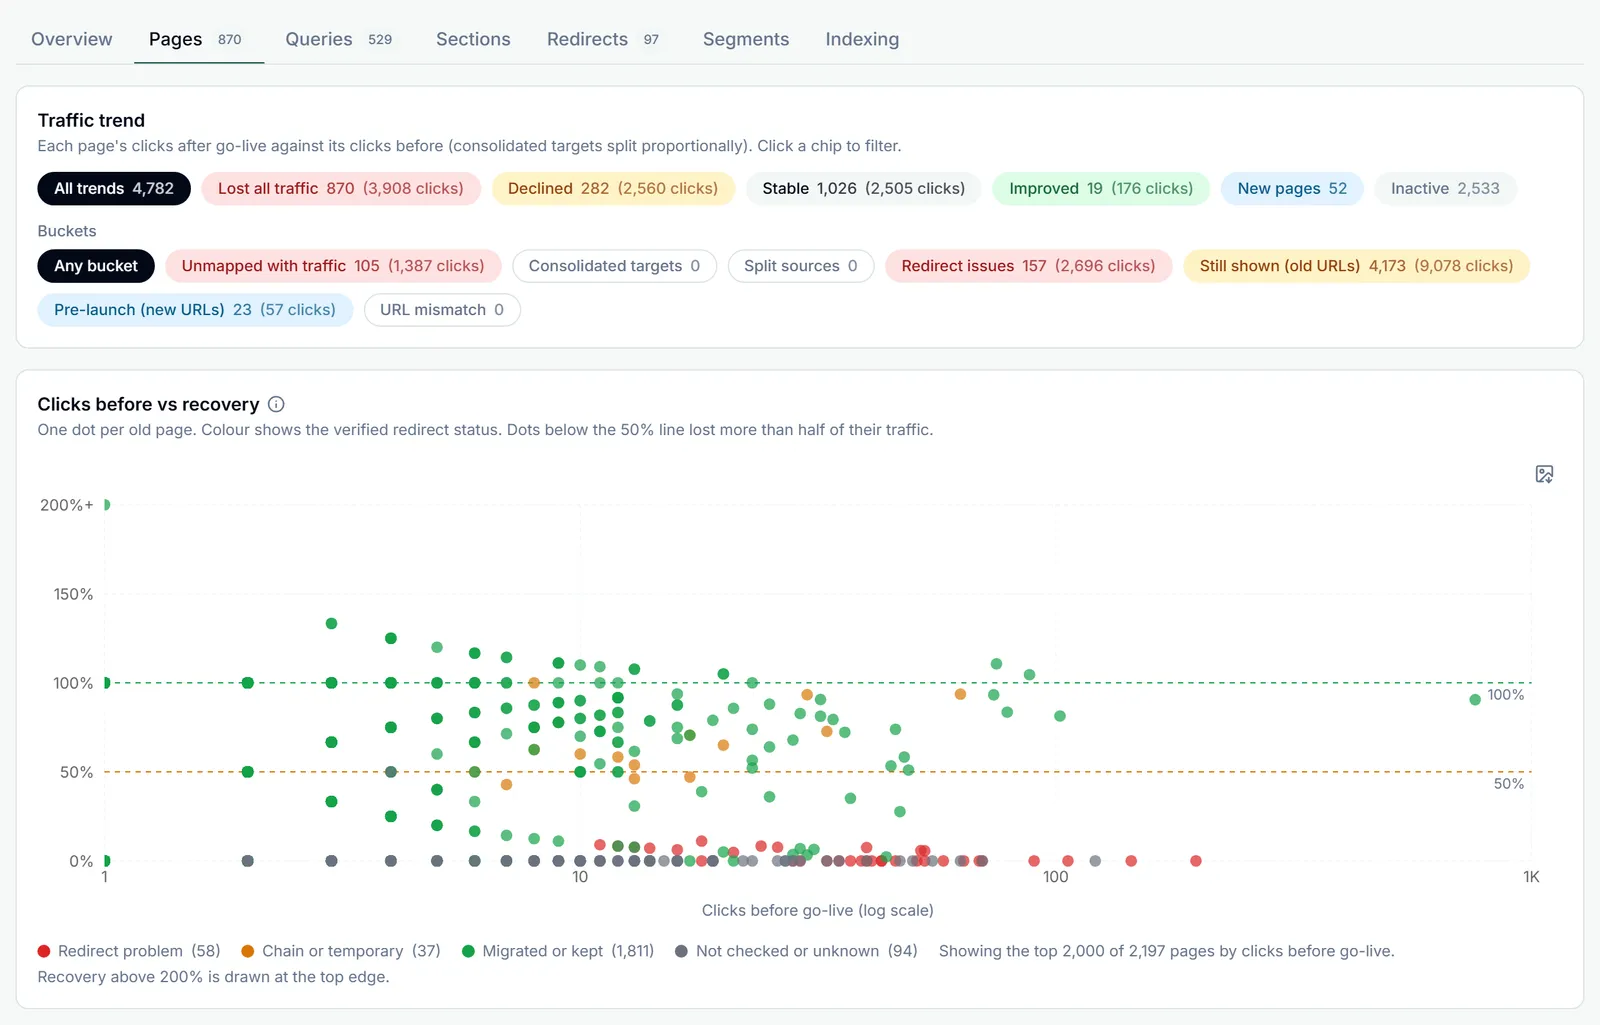
Each page’s clicks after go-live against its clicks before. With a map, an old URL sits next to its new URL; without one, pages are joined by path.
- Trend chips: Lost all traffic (clicks before, none after), Declined and Improved (a change of at least 10% and at least 1 click), Stable, New pages (no clicks before, clicks after) and Inactive (impressions only). Click a chip to filter.
- Bucket chips: Unmapped with traffic, Consolidated targets, Split sources, Redirect issues (broken, missing, wrong, chained, temporary or to the home page, plus noindexed or canonicalised targets), Still shown (old URLs), Pre-launch (new URLs) and URL mismatch.
- Clicks before vs recovery: one dot per old page, with clicks before on a log scale. Dots below the 50% line lost more than half their traffic. Dots are coloured by redirect status once the redirects are verified, by trend until then. Click a dot to find the page in the table.
- The table adds CTR and position before and after, the redirect status and reason, the unit kind and the old and new section. Search it by old or new URL.
Queries: what searchers lost and found
The same trends for search queries, with CTR change in points and position change, where lower is better.
- Position movement: each query placed by its impression-weighted position before go-live (rows) and after (columns), in the buckets 1-3, 4-10, 11-20, 21-50, 51+ and Not ranking. The summary counts queries that moved up, moved down, stayed, dropped out and are newly ranking. Click a cell to filter the table.
- Query topics: queries grouped by a shared word or two-word phrase, largest click losses first. A topic needs at least three queries. The bar shows the size of the click change; red means recovery under 50%, amber under 90%.
- Branded vs non-branded: recovery of each, using the branded keywords saved in the Property Setup of either property. Branded queries usually survive a migration because people search for the name anyway; non-branded recovery shows whether rankings moved over.
- Query handover, loaded on demand with Find where queries landed: for every query with clicks before go-live, the old page that carried it, the target the map expects (or the same path without a map), and the new page that carries it now. Outcomes are Mapped target, Other new page (a weak mapping, or two new pages competing for the query), Old page still ranks, Lost and Unmapped source.
Sections: which parts of the site moved well
Pages grouped by folder, so a template or a category that did badly stands out.
- URL sections: pages, clicks, share of clicks and recovery per section. Section depth (1 to 4 folders, also in the setup) sets how many folders make a section and applies instantly. A leading locale folder such as /en/ or /de-de/ is kept but does not count towards the depth, numeric folders become {n} and id-like folders {id}, and the host is added when a side spans several hosts.
- Where section traffic went: old sections on the left, new sections on the right, following the map. A link’s width is the clicks before go-live and its colour the recovery; old pages with traffic that no mapping covers flow to Not covered by the mapping. It needs a redirect map.
- Recovery by section: a treemap where size is clicks before go-live and colour is recovery, so big red tiles are where the most traffic was lost. Click a tile to find it in the table.
- Redirect rules: patterns read from each old URL and its new URL, with the recovery of each: Same path, Lowercased, Trailing slash, Extension dropped, To parent folder, Folder swapped, Slug kept, To home page and Other.
Redirects: did every redirect work
- Verify redirects: the same check as in the Redirect mappings panel, with the date of the last run.
- Redirect status: one verdict per mapping, worst first, with the problem count and the clicks at stake. Click a status to list its mappings.
- The flags found on checked redirects, and a table with each mapping’s final URL, final status code, hops, the full chain, its flags, the target page’s title, canonical and noindex, and whether the check came from the crawler or from Screaming Frog.
- Google’s view: URL Inspection on the top pairs and the handover stage of each.
Statuses, flags and stages are listed in Redirect maps and verification.
Segments: was a country, device or search type left behind
A healthy total can hide one segment that collapsed.
- Recovery by country: a country far below the rest often points at hreflang, a dropped language folder or a geo redirect.
- Recovery by device: desktop, mobile and tablet. A device far below the others usually means the new templates render or perform worse there.
- Recovery by search type, loaded on demand with Compare web, image, video, news and Discover: each search type read for both windows. Image traffic is the one most often lost, when image URLs change with a new CDN, renamed files or a new image path, even when web traffic recovers.
- The Bing data source has no country or device breakdown.
Indexing: has Google swapped the URLs
How fast Google stopped showing the old URLs and started showing the new ones. It needs a go-live date.
- Impression handover: the old and new sides’ share of impressions over the trailing 7 days, from go-live on, with the days the new side passed 50% and 90%.
- Pages in search per day: how many old and new pages had at least one impression each day. The old line should fall after go-live and the new one rise towards it. It reads the GSC Wizard warehouse, so the properties need to be synced in Dashboard Management.
- Residual old URLs: old URLs with impressions after go-live. Some overlap in the first weeks is normal while Google recrawls; old URLs that keep showing up after a month usually do not redirect permanently.
- Pre-launch URLs: new URLs that had impressions before go-live, from a staging site that was indexable, an early launch or a soft launch. They can split signals between the old and the new URL.
Part of Migration analysis. Related: Health, recovery and risk, Redirect maps and verification.