Optimization
Content Decay Map
A page-by-time heatmap that makes slow traffic loss visible so you can prioritise refreshes.
Run analysis
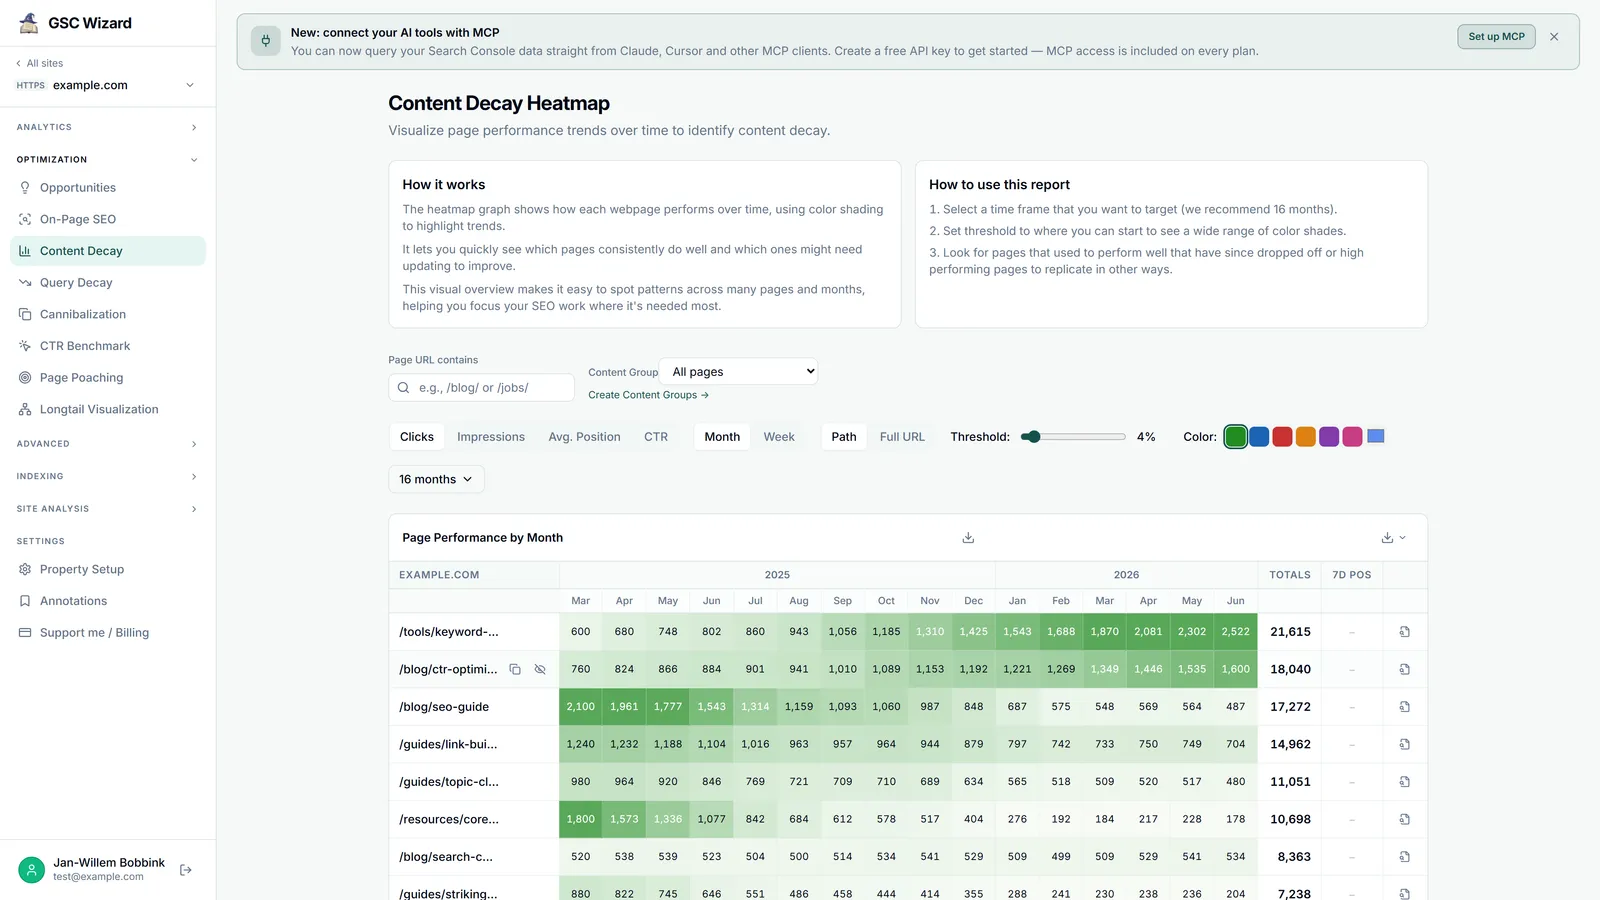
Content decay is the gradual traffic loss a page suffers as it ages or competitors improve. Rows are pages, columns are months or weeks, and each cell is shaded by the metric you pick over a window of up to 24 months.
What you get
- A metric toggle (clicks, impressions, average position, CTR) and a threshold slider with colour presets to tune the shading.
- Filters for page URL, content group, and click-to-exclude URLs.
- The top 50 pages with a totals column, a 7-day average-position column, and a shortcut to run the On-Page SEO Check per row.
- CSV and HTML export (every period’s metrics are included).
The heavy aggregation runs in your browser after you press Load Heatmap Data, so the page stays responsive on large sites.
Part of Opportunities & quick wins. Related: Query Decay Map, On-Page SEO Check.