Optimization
Long-Tail Visualization
See how concentrated your traffic is by splitting pages into Head, Chunky Middle, and Long Tail tiers.
Run analysis
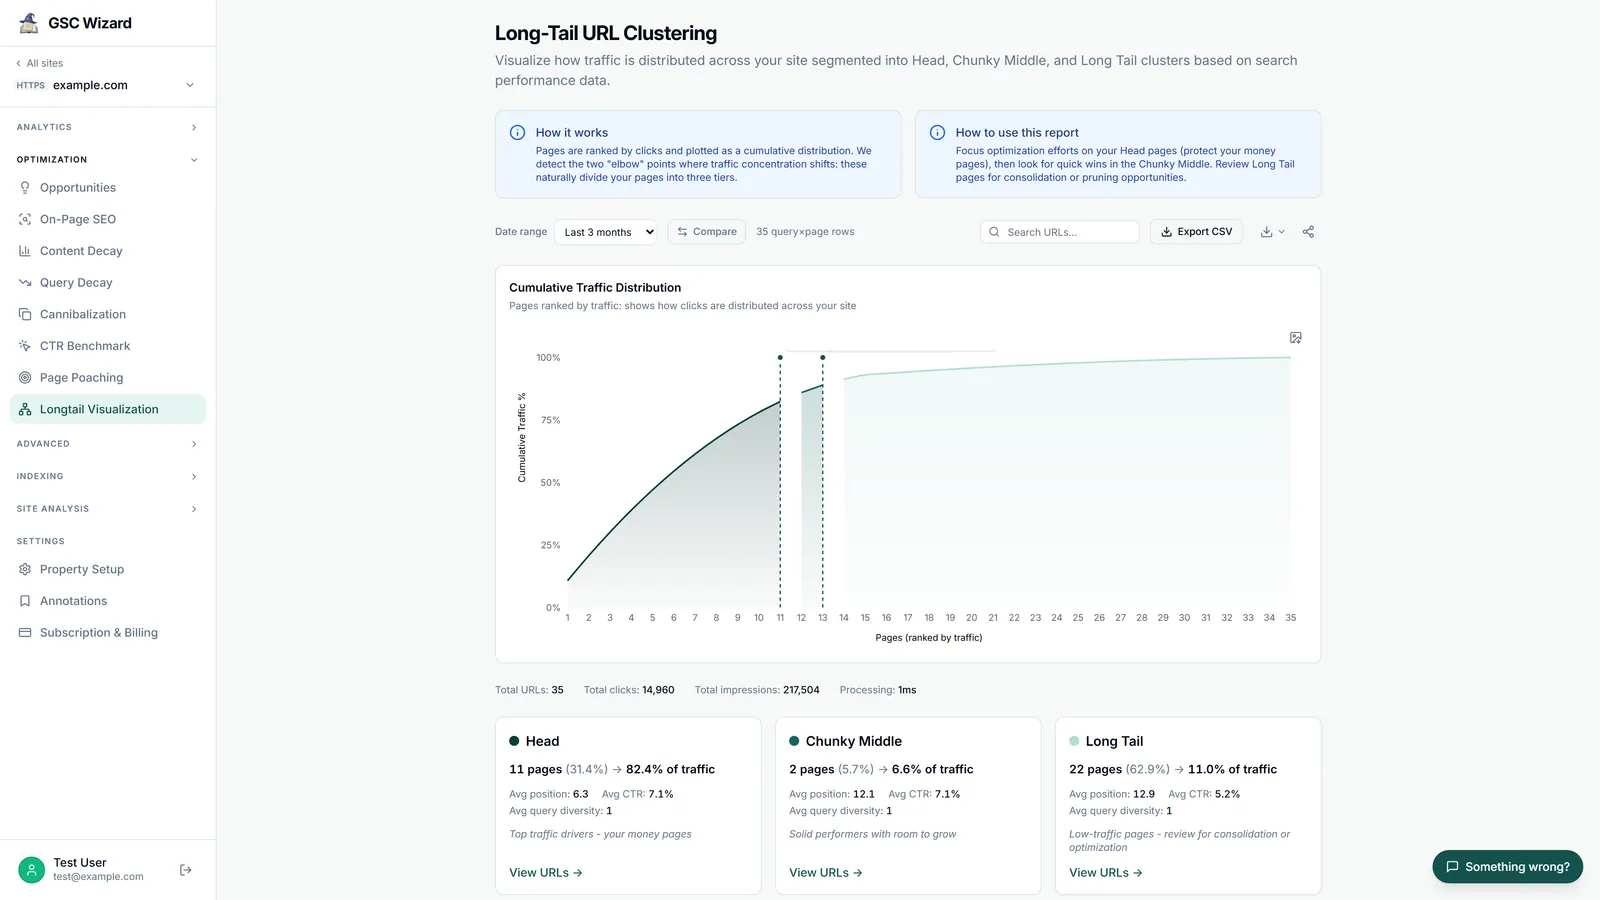
Pages are ranked by clicks and plotted as a cumulative distribution; the algorithm smooths the curve and detects two “elbow” points to divide the three tiers, so you can protect money pages, find quick wins, and prune dead weight.
What you get
- A cumulative chart with knee markers and per-cluster summary cards.
- Expandable per-URL tables (clicks, impressions, weighted CTR, average position, query diversity).
- A Compare toggle that overlays the equivalent previous period, plus date-range, content-group, search, and advanced-settings controls.
- CSV and HTML export.
Very large sites run the clustering in your browser so the UI stays responsive.
Part of Opportunities & quick wins.