Google Update Checker
For every confirmed Google update, did your clicks move more than they normally do?
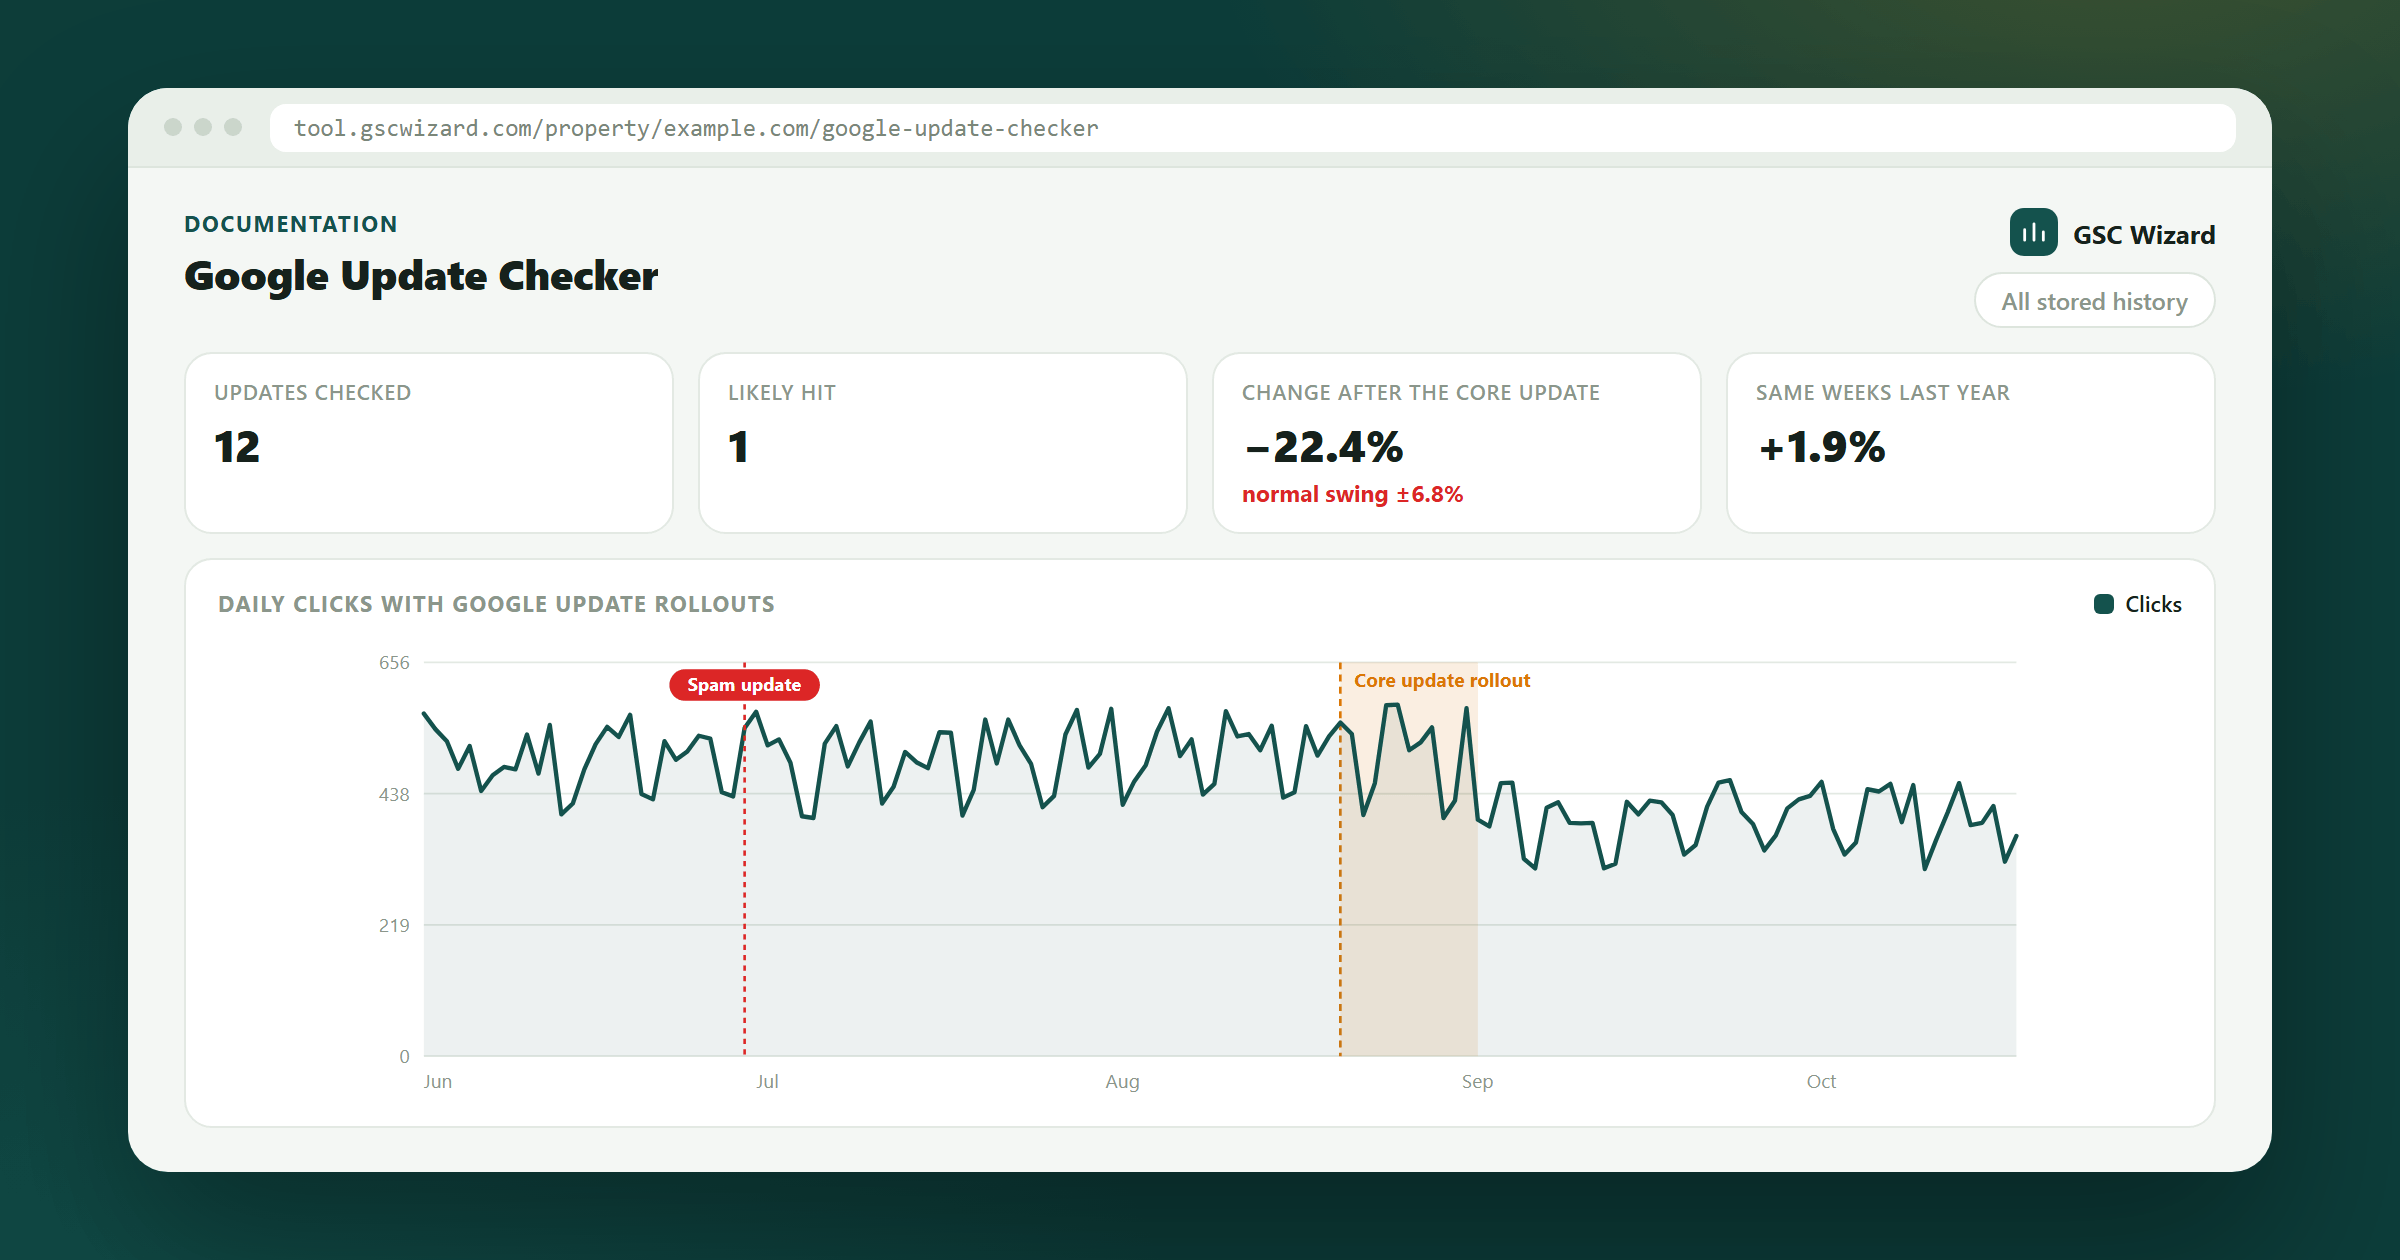
The report puts two things side by side: your property’s daily clicks, impressions and average position, and Google’s own list of confirmed ranking updates from the Google Search Status Dashboard. Only the dashboard entries filed under Ranking are used, so indexing and crawling incidents stay out. The dashboard’s live feed covers the last twelve months; older updates, back to the November 2021 core update, come from a stored copy of the same list. The list is refreshed once a day.
How to run it
- Open the property, expand SITE ANALYSIS in the left sidebar and click Google Update Checker.
- Choose All stored history (from October 2021, as far back as the property’s data goes) or Last 16 months. How far back stored history reaches depends on whether the property is kept in warehouse storage; a property read live from Google has about 16 months.
- Click Run analysis. Nothing loads until you do.
How each update is scored
Every update that starts at least a week into your data gets a row, newest first.
- The 28 days before the rollout started are compared with the 28 days after it finished, and the rollout days themselves are left out. Days are Search Console’s Pacific-time days, the same time zone the status dashboard uses.
- When your data does not yet reach 28 days past the end, both windows shrink to the same number of whole weeks, at least one, so weekdays always line up. The row then says how many weeks it used.
- A neighbouring update’s rollout is kept out of both windows, so a drop from one update is not counted again across the next. If that leaves less than a week on one side, the windows include the neighbour and the row says so (Windows include the … rollout). Updates whose rollouts overlap are named under the update (Overlaps with …), because clicks alone cannot tell them apart.
- When your data covers the same weeks 364 days earlier, last year’s change over those weeks is taken out first, so a seasonal dip is not blamed on an update. The result is the adjusted change.
- The normal swing is the median change between two windows of the same length and gap, slid a week at a time across all of your data. It is what a month-to-month move looks like on your site when no update is involved.
| Verdict | When |
|---|---|
| Normal movement | The adjusted change is smaller than the normal swing, or smaller than 5%. |
| Likely hit / Likely boost | The adjusted change is at least twice the normal swing and at least 10%, down or up. |
| Possible drop / Possible gain | Anything between those two. |
| Rolling out | Google has not marked the rollout finished, so there is no after window yet. |
| Not enough data | Less than a week of data after the rollout; the row says how many days to wait. |
What you get
- A summary at the top: the update that looks most like a hit, with clicks a day before and after, the change, the adjusted change and the normal swing. Without a hit it names the biggest boost, and without either it says no update moved the site beyond its normal swing.
- Type chips for Core, Spam, Reviews & helpful content, and Other, which hide or show those updates in the chart and the table. Hidden updates still count when the windows are drawn.
- A chart of daily clicks and their 7-day average, with each rollout shaded in its type’s colour; the tooltip names the updates rolling out on that day. The chart exports as a PNG.
- A table with the update and its dates, clicks a day before and after, the change and the normal swing, the same weeks last year with the adjusted change, the impressions change, the average position before and after, and the verdict.
- CSV export of every scored update, with its type, both dates in Pacific time, the window length, clicks a day before and after, the change, last year’s change, the adjusted change, the normal swing, the impressions change and the verdict. The file name carries the date range, like every export.
The verdict reads clicks only; impressions and position sit next to it to help explain a move. A lower position with steady impressions points at rankings, while fewer impressions at the same position points at demand. A verdict says that clicks moved around the update’s dates more than usual, not that the update caused it. If clicks fell and no update explains it, look for a seasonal, technical or on-site cause.
The report needs nothing beyond access to the property, so it works on properties shared with you too. To check a site without an account, the free Google Algorithm Update Checker runs the same calculation on a Search Console export in your browser. From an AI assistant, the list_algo_updates tool returns the same list of confirmed updates for a date range; see Connecting AI assistants.
Part of Site analysis & annotations. Related: Annotations, Change Point Detection, Anomaly Detection.