GA4 Experiments
Measure an SEO experiment on what happened after the click: sessions, key events, conversion rate and revenue.
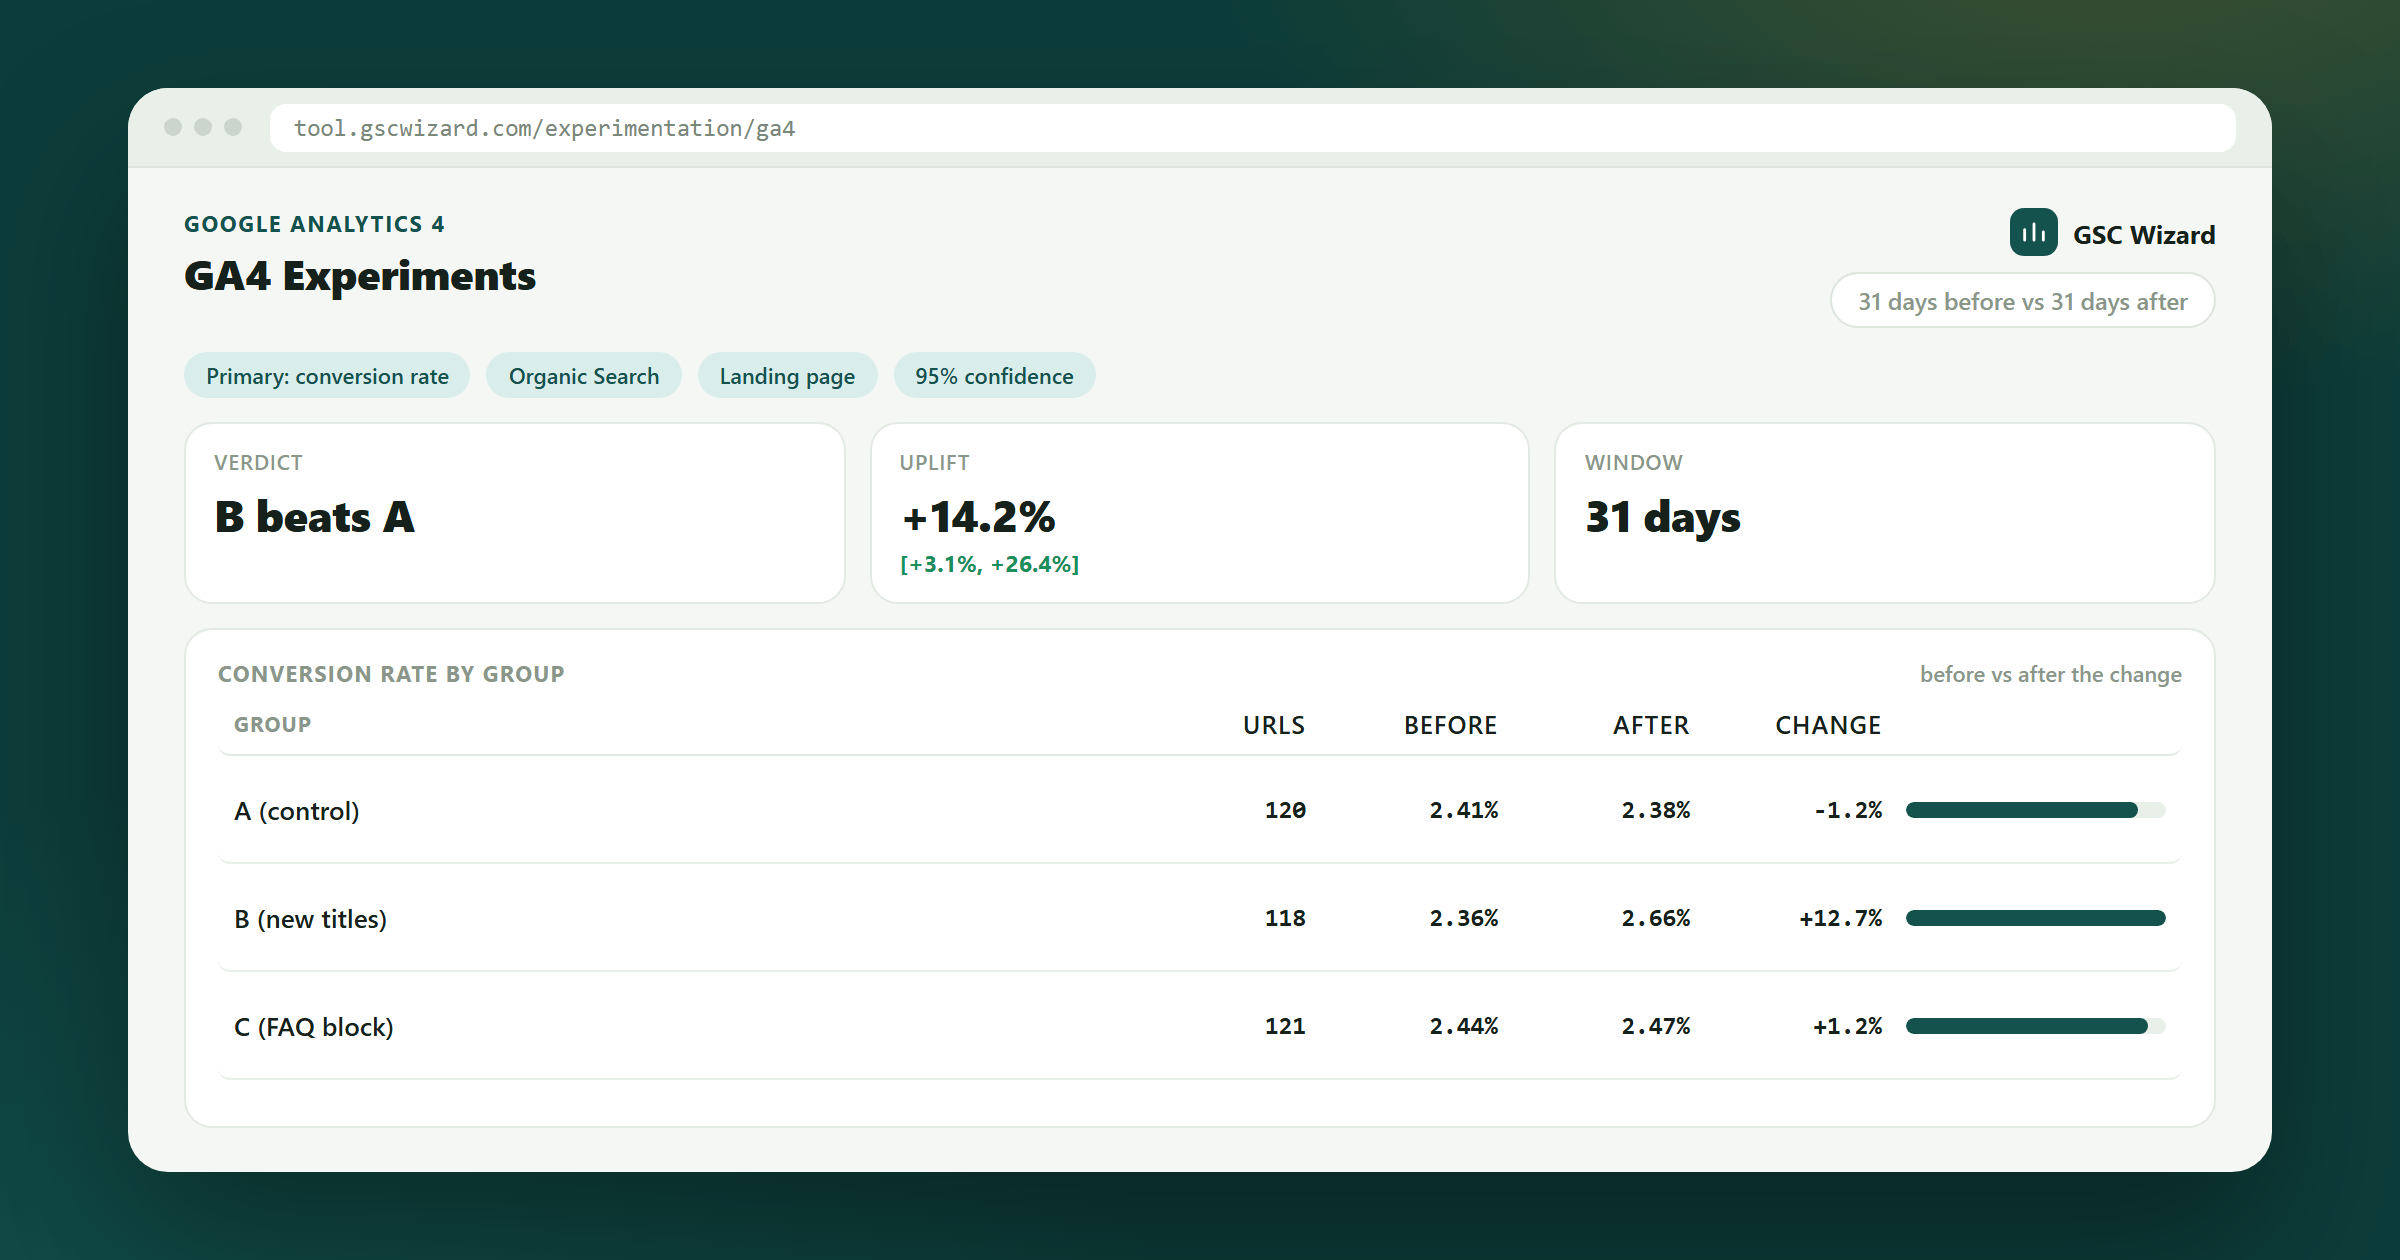
The Experimentation report tells you whether a change moved Search Console clicks. GA4 Experiments takes the same experiment, with the same URL groups and the same start date, and reads it in Google Analytics 4, so you can see whether the change also brought more conversions or more revenue. Open it from the GA4 tab at the top of the Experimentation report, or from Experimentation › GA4 Experiments in the left menu.
Before you start
- A GA4 property coupled to the site.
- An experiment created on the Experimentation page, with two or more URL groups. The first group is the control.
- A start date: the day the change went live. An experiment without one asks for it before anything else, because a before-and-after read needs it.
Choose what to measure
Each experiment has its own GA4 setup, saved with the experiment.
- Primary metric: the one metric the verdict is about. Traffic (sessions, views), engagement (engaged sessions, engagement rate, bounce rate, average session duration), conversions (key events, conversion rate, the count of one named event) or ecommerce (revenue, transactions, average order value, add-to-carts, checkouts). For bounce rate, lower is better, and the verdict reads it that way.
- Secondary metrics: up to four more, shown with their intervals but without a winner.
- Event name: for key events and conversion rate, optionally one key event such as
purchase(blank counts all key events). The named event count needs one, such assign_up. - Channel: Organic Search, the usual choice for an SEO change, or all channels.
- Page dimension: landing page counts the sessions that started on a group’s pages; page path counts every view of those pages, wherever the session started.
Pick the primary metric before the change goes live. If you pick or change it after the start date, the result says so, because a metric chosen once results are visible tends to favour whatever happened to move.
Ecommerce metrics need GA4 ecommerce tracking (the purchase and add_to_cart events). On a property without it they read as zero.
How to run it
- Nothing is read from GA4 until you press Run analysis.
- Pick the window: 7 days, 14 days, 31 days, 3 months or all. The before window has the same length and ends the day before the start date.
- Pick the confidence level: 90%, 95% (the default) or 99%.
- GA4 is read live from your property and the result is kept for an hour. The newest two days are left out, because GA4 is still processing them.
- The after window needs at least 7 complete days. Until then the page shows the before numbers and the first date a read is possible.
What you get
- A verdict on the primary metric, one line per variant against the control: it beats the control, does worse, or shows no clear difference, with the estimate and its interval.
- The secondary metrics with their intervals but no winner, because testing several metrics makes a chance difference on one of them likely.
- A table per group with each metric before, after and the change, plus how many of the group’s URLs had GA4 data.
- A daily chart per metric with the start date marked.
- Data-quality notes when GA4 withheld rows for thresholding, folded pages into “(other)”, or when experiment URLs had no GA4 data or sit on another host.
- A CSV export, with both date ranges in the filename.
How the verdict is worked out
Two methods, because counts and money do not behave the same way.
- Counts (sessions, views, key events, transactions, add-to-carts and the like): the growth of the variant from before to after, minus the growth of the control, in percentage points. It is the same Poisson test the Search Console experiment uses.
- Rates, averages and revenue: one large order can move revenue on its own, and a rate has two parts that both move, so these use a daily difference-in-differences with a weekly block bootstrap. The result is the variant’s relative uplift against the control, in percent. It needs at least 14 days in each window, and short windows get wider intervals, so a 14-day read only shows large effects.
- Volume guard: with fewer than 30 of the underlying count (sessions, key events or transactions) in either window for either group, the verdict is “Too few conversions to judge”, never a winner.
- URL matching: experiment URLs are matched to GA4 page paths the same way the Search Console experiment matches them, ignoring letter case, a trailing slash and
www., so a group means the same pages on both reports. - Up to ten groups are measured: the control and nine variants.
Results are observational. The groups are sets of pages, not randomly assigned visitors, and anything else that changed in the same weeks affects them too. Read a clear result as strong evidence, not as a controlled trial.
The property owner can always use it. Someone the property is shared with needs GA4 access in their grant.
Part of Google Analytics 4. Related: Experimentation, Key Events, Blended (GSC + GA4).